OPEN-SOURCE SCRIPT
Optimal Leverage Indicator
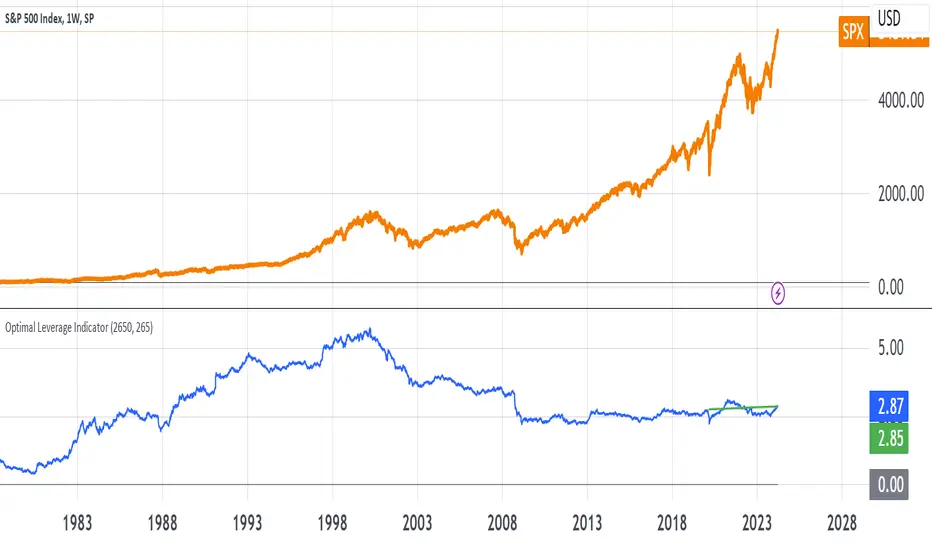
The goal of this indicator is to calculate and visualize the optimal leverage and average leverage for a given security based on its historical price data. The optimal leverage is determined by analyzing the relationship between the annualized return and annualized volatility of the security over a specified lookback period.
The methodology can be broken down into the following steps:
Data Input:
The script takes two user inputs: the lookback period and the number of annual trading days.
The lookback period determines the number of historical data points used in the calculations.
The number of annual trading days is used to annualize the return and volatility metrics.
Daily Returns Calculation:
The script retrieves the closing prices of the security on a daily timeframe.
It calculates the daily returns by comparing the current close price with the previous close price.
Mean Return and Volatility Calculation:
The script calculates the mean daily return by taking the simple moving average (SMA) of the daily returns over the specified lookback period.
It also calculates the volatility by taking the standard deviation of the daily returns over the same lookback period.
Annualized Return and Volatility Calculation:
The mean daily return is annualized by compounding it over the number of annual trading days.
The daily volatility is annualized by multiplying it by the square root of the number of annual trading days.
Optimal Leverage Calculation:
The optimal leverage is calculated using the formula: Optimal Leverage = Annualized Return / (Annualized Volatility)^2
This formula assumes that the optimal leverage is proportional to the ratio of the annualized return to the square of the annualized volatility. This is based in this paper: papers.ssrn.com/sol3/papers.cfm?abstract_id=1664823
Average Leverage Calculation:
The script calculates the average leverage by taking the simple moving average (SMA) of the optimal leverage over the specified lookback period.
This provides a smoothed representation of the optimal leverage over time.
The script plots two lines on the chart:
The optimal leverage line (blue) represents the calculated optimal leverage values over time.
The average leverage line (green) represents the average of the optimal leverage values over the specified lookback period.
The main idea behind this methodology is to determine the optimal leverage based on the historical risk-return characteristics of the security. By analyzing the relationship between the annualized return and volatility, the script aims to identify the leverage level that maximizes the return relative to the risk.
The average leverage line provides a smoothed representation of the optimal leverage over time.
Script open-source
Nello spirito di TradingView, l'autore di questo script lo ha reso open source, in modo che i trader possano esaminarne e verificarne la funzionalità. Complimenti all'autore! Sebbene sia possibile utilizzarlo gratuitamente, ricordiamo che la ripubblicazione del codice è soggetta al nostro Regolamento.
Medium Blog: medium.com/@henriquecentieiro
Declinazione di responsabilità
Le informazioni e le pubblicazioni non sono intese come, e non costituiscono, consulenza o raccomandazioni finanziarie, di investimento, di trading o di altro tipo fornite o approvate da TradingView. Per ulteriori informazioni, consultare i Termini di utilizzo.