OPEN-SOURCE SCRIPT
RedK_Fibonacci on Doncian (RedK_FibDC_v1)
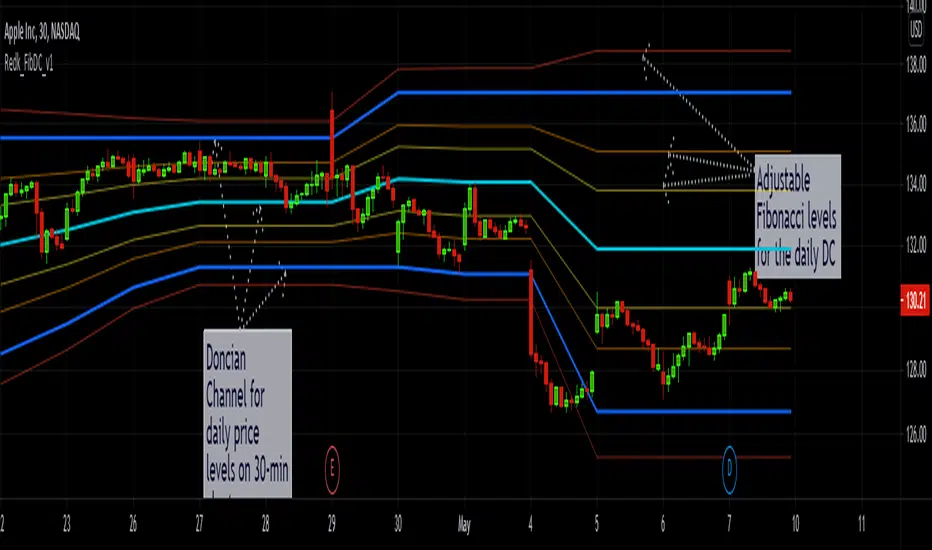
this is a quick script that gives the ability to plot a simple Doncian Channel with optional Fibonacci levels calculated against the DC channel breadth.
a Doncian channel is simply a channel that represents the highest high and lowest low of the price for a certain period (number of bars) -- the concept of watching these extreme values is the basis of many other technical indicators in chart analysis.
A script like this may come useful for setting entry and exit levels and can be used to plot the DC & Fib levels for a higher resolution than the chart - in the example, we're looking at the DC & its Fib levels for the daily resolution on a 30-min chart.
there are 3 adjustable levels that are set by default to 0.368, 0.618, and 1.272 -- and they can be set to any other levels we need to monitor - not necessarily Fib-based at all - say to determine a possible breakout or breakdown... etc
this script makes use of the "resolution" and "inline / group" features (powers) of Pine :)
Script open-source
Nello spirito di TradingView, l'autore di questo script lo ha reso open source, in modo che i trader possano esaminarne e verificarne la funzionalità. Complimenti all'autore! Sebbene sia possibile utilizzarlo gratuitamente, ricordiamo che la ripubblicazione del codice è soggetta al nostro Regolamento.
Declinazione di responsabilità
Le informazioni e le pubblicazioni non sono intese come, e non costituiscono, consulenza o raccomandazioni finanziarie, di investimento, di trading o di altro tipo fornite o approvate da TradingView. Per ulteriori informazioni, consultare i Termini di utilizzo.