OPEN-SOURCE SCRIPT
MA Visualizer
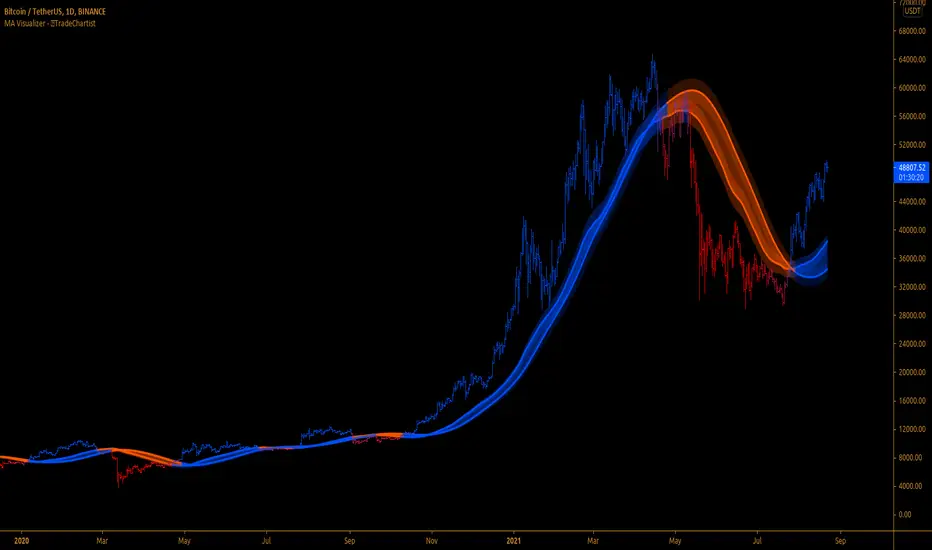
™TradeChartist MA Visualizer is a Moving Average based indicator aimed to visualize price action in relation to the Moving Average in a visually engaging way.
===================================================================================================================
█ MA Visualizer Features
█ Example Charts
1. 1hr chart of XAUUSD using 55 period WMA.

2. 15m chart of
 EURUSD using 144 period Tillson T3 MA.

3. 4 hr chart of US30USD using 55 period SMMA.

===================================================================================================================
Best Practice: Test with different settings first using Paper Trades before trading with real money
===================================================================================================================
===================================================================================================================
█ MA Visualizer Features
- 11 different Moving Averages to choose from the settings to visualize based on MA Visualizer Length (Default - 55 period SMA).
- 2 Smoothing options (default - 0, 0 uses MA length as Smoothing factor, 1 uses no Smoothing).
- 4 colour themes to choose from and option to adjust Visualizer Vibrance.
█ Example Charts
1. 1hr chart of
2. 15m chart of
3. 4 hr chart of
===================================================================================================================
Best Practice: Test with different settings first using Paper Trades before trading with real money
===================================================================================================================
Script open-source
In pieno spirito TradingView, il creatore di questo script lo ha reso open-source, in modo che i trader possano esaminarlo e verificarne la funzionalità. Complimenti all'autore! Sebbene sia possibile utilizzarlo gratuitamente, ricorda che la ripubblicazione del codice è soggetta al nostro Regolamento.
Get in touch with me if you would like access to my Premium scripts for a trial before deciding on lifetime access.
Telegram - @Trade_Chartist
Free Scripts - bit.ly/Free-Scripts
Telegram - @Trade_Chartist
Free Scripts - bit.ly/Free-Scripts
Declinazione di responsabilità
Le informazioni ed i contenuti pubblicati non costituiscono in alcun modo una sollecitazione ad investire o ad operare nei mercati finanziari. Non sono inoltre fornite o supportate da TradingView. Maggiori dettagli nelle Condizioni d'uso.