OPEN-SOURCE SCRIPT
Aggiornato Quantile Support & Resistance
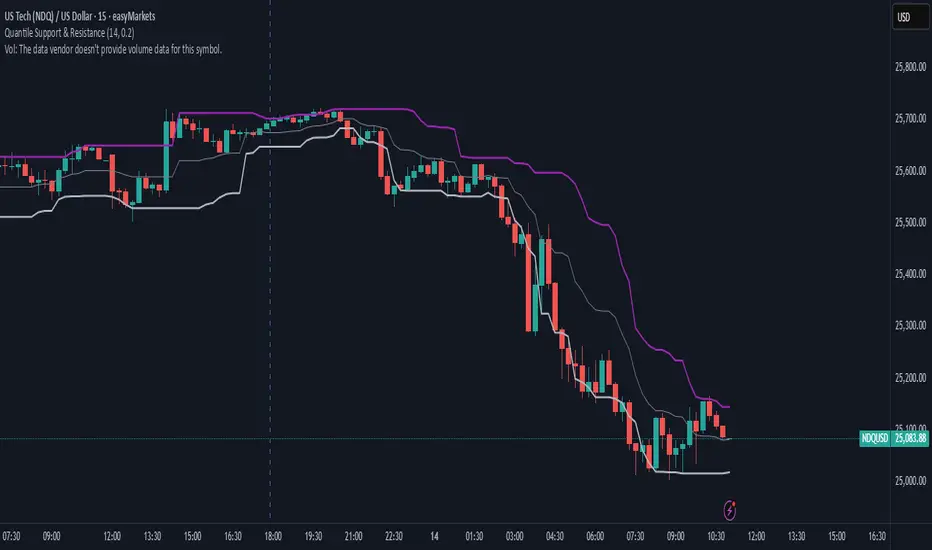
This indicator plots dynamic support and resistance zones based on quantile logic — a statistically grounded method for identifying structural price boundaries.
Support Level: The price below which only a small percentage of lows fall (default: 10%). This approximates a strong demand zone.
Resistance Level: The price above which only a small percentage of highs rise (default: 10%). This approximates a strong supply zone.
Volatility-Adaptive: Levels adjust automatically to changing market conditions using a configurable lookback window.
Quantile Interpolation: Uses sorted price data and fractional indexing to estimate percentile thresholds with precision.
This tool is ideal for traders who want to visualize statistically significant price zones without relying on subjective drawing or fixed levels. It pairs well with breakout strategies, retest logic, and compression overlays.
Note di rilascio
Update:Added midpoint band for clearer mean-reversion targeting
Refreshed color scheme for improved visual contrast and clarity
Changed default inputs for a better fit
This enhances structural readability and makes entry/exit zones more intuitive across timeframes.
Script open-source
Nello spirito di TradingView, l'autore di questo script lo ha reso open source, in modo che i trader possano esaminarne e verificarne la funzionalità. Complimenti all'autore! Sebbene sia possibile utilizzarlo gratuitamente, ricordiamo che la ripubblicazione del codice è soggetta al nostro Regolamento.
Declinazione di responsabilità
Le informazioni e le pubblicazioni non sono intese come, e non costituiscono, consulenza o raccomandazioni finanziarie, di investimento, di trading o di altro tipo fornite o approvate da TradingView. Per ulteriori informazioni, consultare i Termini di utilizzo.