OPEN-SOURCE SCRIPT
Unseen Pivot Points
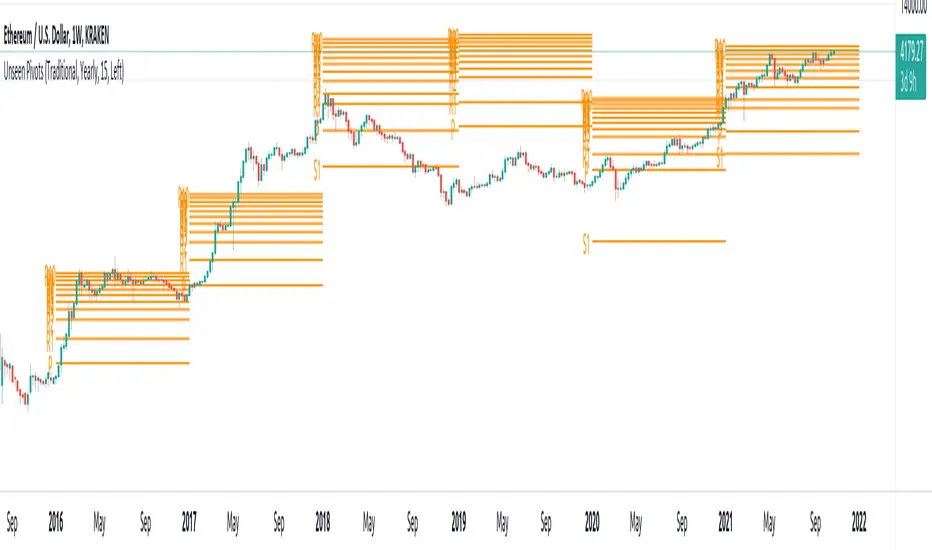
This script takes the standard TV pivot points indicator and extend it to new Pivot levels never unrevealed before.
In short: I applied the formula of traditional Pivots to calculate R6 to R10 and S6 to S10 Pivots into a new Indicator.
As you probably know, there are not more than five levels of Support or Resistance in each direction when it comes to Pivots. Why is it that Chartists don't use more than those five Pivot levels? As a historical search have yield no real answer I could only speculate that simply no one ever bothered to calculate them since markets did not put that to the question with their volatility, price behavior and returns.
But I also speculated that plotting more pivots, especially to the upside, can serve as a road map for exponential assets like the ones we got used to in the last years, i.e. Crypto markets.
And indeed have more pivots turns out to be surprisingly useful when it comes to mooning assets.
I have applyed the same calculation from the R3/S3 on and rolled it into the creation of the R6/S6 like this:
R6 = PP * 5 + (HIGHprev - 5 * LOWprev) S5 = PP * 5 - (5 * HIGHprev - LOWprev)
And so forth until R10/S10. Not a rocket science!
Enjoy!
Script open-source
Nello spirito di TradingView, l'autore di questo script lo ha reso open source, in modo che i trader possano esaminarne e verificarne la funzionalità. Complimenti all'autore! Sebbene sia possibile utilizzarlo gratuitamente, ricordiamo che la ripubblicazione del codice è soggetta al nostro Regolamento.
Declinazione di responsabilità
Le informazioni e le pubblicazioni non sono intese come, e non costituiscono, consulenza o raccomandazioni finanziarie, di investimento, di trading o di altro tipo fornite o approvate da TradingView. Per ulteriori informazioni, consultare i Termini di utilizzo.