OPEN-SOURCE SCRIPT
Trend 1
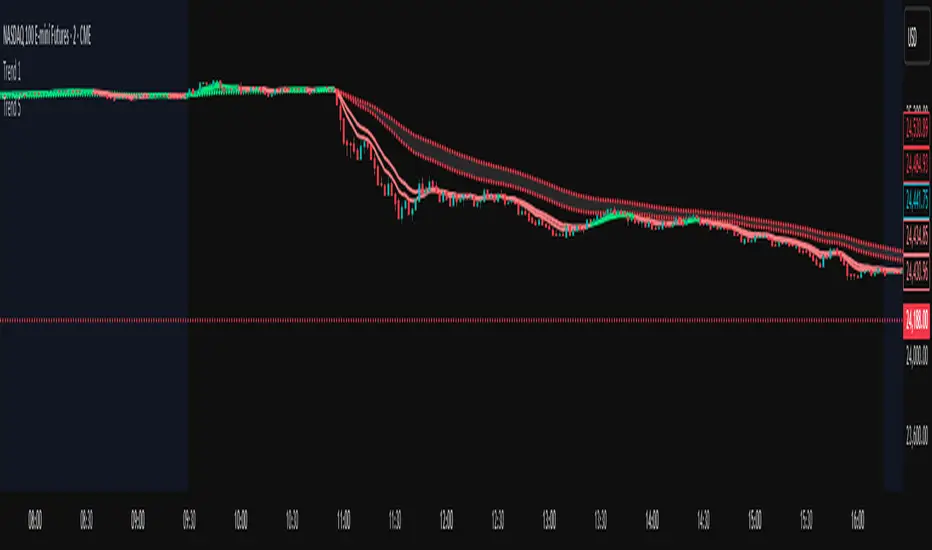
EMA Trend tracker.
This script plots two EMAs: a short-term EMA (line) and a long-term EMA (dots). The line color turns green when the short EMA is above the long EMA, and red when it’s below. Users can select a custom timeframe for the EMA calculation using the input settings. A shaded area is drawn between the two EMAs to visually represent the trend zone.
This script plots two EMAs: a short-term EMA (line) and a long-term EMA (dots). The line color turns green when the short EMA is above the long EMA, and red when it’s below. Users can select a custom timeframe for the EMA calculation using the input settings. A shaded area is drawn between the two EMAs to visually represent the trend zone.
Script open-source
Nello spirito di TradingView, l'autore di questo script lo ha reso open source, in modo che i trader possano esaminarne e verificarne la funzionalità. Complimenti all'autore! Sebbene sia possibile utilizzarlo gratuitamente, ricordiamo che la ripubblicazione del codice è soggetta al nostro Regolamento.
Declinazione di responsabilità
Le informazioni e le pubblicazioni non sono intese come, e non costituiscono, consulenza o raccomandazioni finanziarie, di investimento, di trading o di altro tipo fornite o approvate da TradingView. Per ulteriori informazioni, consultare i Termini di utilizzo.