OPEN-SOURCE SCRIPT
VIX-Price Covariance Monitor

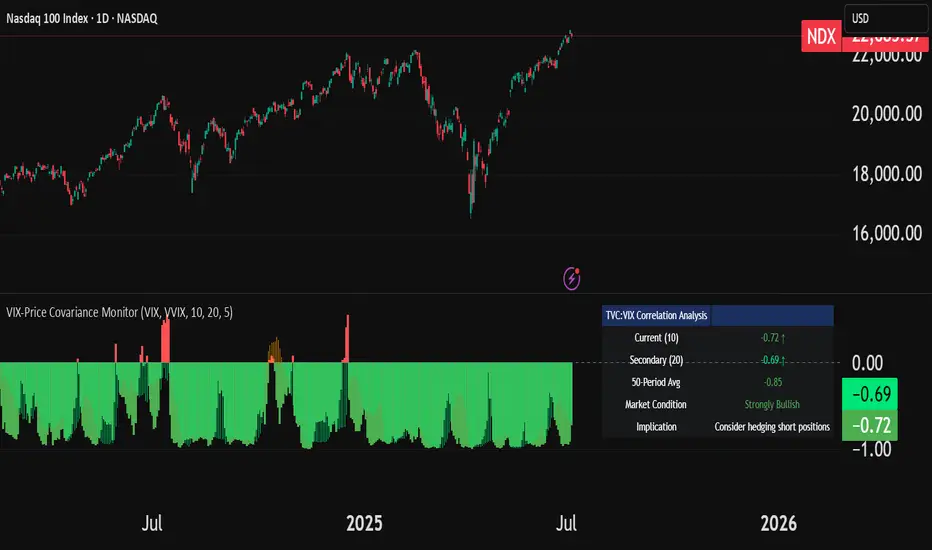
The VIX-Price Covariance Monitor is a statistical tool that measures the evolving relationship between a security's price and volatility indices such as the VIX (or VVIX).
It can give indication of potential market reversal, as typically, volatility and the VIX increase before markets turn red,
This indicator calculates the Pearson correlation coefficient using the formula:
ρ(X,Y) = cov(X,Y) / (σₓ × σᵧ)
Where:
Enjoy!
Features
Interpretation
How to use it
It can give indication of potential market reversal, as typically, volatility and the VIX increase before markets turn red,
This indicator calculates the Pearson correlation coefficient using the formula:
ρ(X,Y) = cov(X,Y) / (σₓ × σᵧ)
Where:
- ρ is the correlation coefficient
- cov(X,Y) is the covariance between price and the volatility index
- σₓ and σᵧ are the standard deviations of price and the volatility index
Enjoy!
Features
- Dual Correlation Periods: Analyze both short-term and long-term correlation trends simultaneously
- Adaptive Color Coding: Correlation strength is visually represented through color intensity
- Market Condition Assessment: Automatic interpretation of correlation values into actionable market insights
- Leading/Lagging Analysis: Optional time-shift analysis to detect predictive relationships
- Detailed Information Panel: Real-time statistics including current correlation values, historical averages, and trading implications
Interpretation
- Positive Correlation (Red): Typically bearish for price, as rising VIX correlates with falling markets. This is what traders should be looking for.
- Negative Correlation (Green): Typically bullish for price, as falling VIX correlates with rising markets
How to use it
- Apply the indicator to any chart to see its correlation with the default VIX index
- Adjust the correlation length to match your trading timeframe (shorter for day trading, longer for swing trading)
- Enable the secondary correlation period to compare different timeframes simultaneously
- For advanced analysis, enable the Leading/Lagging feature to detect if VIX changes precede or follow price movements
- Use the information panel to quickly assess the current market condition and potential trading implications
Script open-source
Nello spirito di TradingView, l'autore di questo script lo ha reso open source, in modo che i trader possano esaminarne e verificarne la funzionalità. Complimenti all'autore! Sebbene sia possibile utilizzarlo gratuitamente, ricordiamo che la ripubblicazione del codice è soggetta al nostro Regolamento.
Medium Blog: medium.com/@henriquecentieiro
Declinazione di responsabilità
Le informazioni e le pubblicazioni non sono intese come, e non costituiscono, consulenza o raccomandazioni finanziarie, di investimento, di trading o di altro tipo fornite o approvate da TradingView. Per ulteriori informazioni, consultare i Termini di utilizzo.