OPEN-SOURCE SCRIPT
High Low Envelope Sigma
Description:
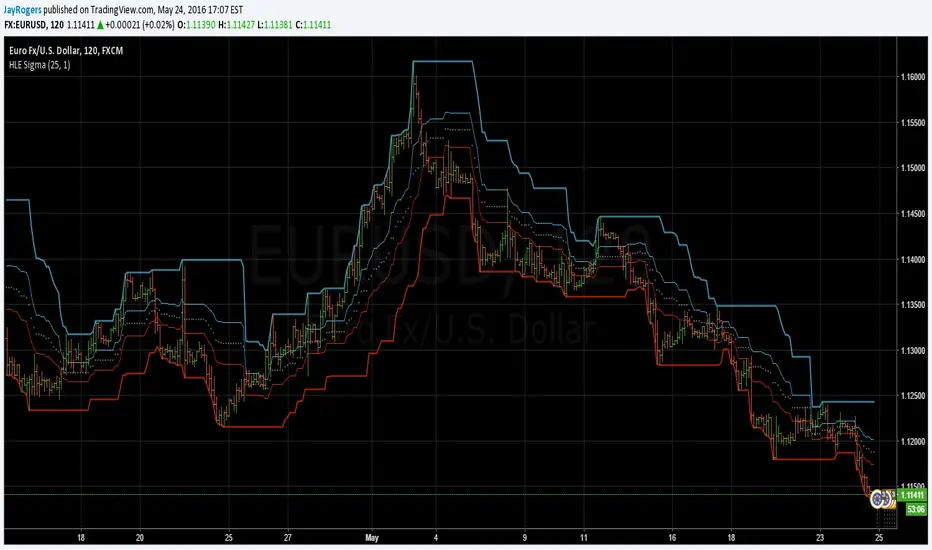
High and Low Envelope channel with median line and 'sigma' offsets to try and encapsulate price flow and quickly locate likely areas of support and resistance on the fly.
High and Low Envelope channel with median line and 'sigma' offsets to try and encapsulate price flow and quickly locate likely areas of support and resistance on the fly.
Script open-source
In pieno spirito TradingView, il creatore di questo script lo ha reso open-source, in modo che i trader possano esaminarlo e verificarne la funzionalità. Complimenti all'autore! Sebbene sia possibile utilizzarlo gratuitamente, ricorda che la ripubblicazione del codice è soggetta al nostro Regolamento.
Declinazione di responsabilità
Le informazioni ed i contenuti pubblicati non costituiscono in alcun modo una sollecitazione ad investire o ad operare nei mercati finanziari. Non sono inoltre fornite o supportate da TradingView. Maggiori dettagli nelle Condizioni d'uso.