FinhedgesFinhedges is a professional-grade trend analysis tool designed for precision trading. Built for traders who demand clarity, accuracy, and reliability, this indicator empowers users with real-time market insights while maintaining a clean and user-friendly visual interface.
✅ Key Features:
📈 Advanced Trend Detection: Accurately identifies prevailing market trends to guide directional bias.
🟢🔴 Intelligent Signal System: Displays high-quality Buy and Sell signals optimized for both swing and intraday trading.
🧠 Smart Filtering Logic: Reduces noise and false signals for higher conviction entries.
📊 Customizable Trend Line: Visualizes trend direction clearly across all timeframes.
⏰ Built-in Alerts: Real-time notifications so you never miss a key opportunity.
📋 Optional Market Status Table: Provides a quick overview of trend and price data directly on the chart.
Trend

TrendBoxThis indicator is called "TrendBox," designed to help traders analyze daily price ranges using several technical indicators. Below is a breakdown of its functionality, purpose, and key components:
Purpose
The script overlays indicators on a chart to assess whether the price is above or below key levels and moving in a trend.
VIX-based expected range (index fund targeted)
- This helps calculate the expected dealers range based on VIX implications. You can expect to see ranges be bought on and sold on. Moving outside this range creates heightened volatility and most of the time a gamma squeeze follows.
VWAP (Volume Weighted Average Price)
- This allows you to understand the mid point or average pricing of the daily session. If you're paying a premium or getting a discount on the daily session.
Daily Market Open
- Identifying the market open price is a key level on a daily session and allows you to identify some level of intraday trend.
Daily 4-period VWMA
- This is a crucial role of our indicator and showing short term time frame bias. Seeing price move over the top of our daily 4 level establishes a short term trend and can be used as a distribution guide, closing positions when we see longer time frame candles close under it. Vice versa for shorting.
It also displays a status box (optional) summarizing whether the price is above or below these levels, helping traders quickly evaluate market conditions.

Market Shift Levels [ChartPrime]Market Shift Levels
This indicator detects trend shifts and visualizes key market structure turning points using Hull Moving Average logic. It highlights potential areas of support and resistance where price is likely to react, empowering traders to spot early trend transitions.
Market Shift Levels are horizontal zones that mark the moment of a directional change in market behavior. These shifts are based on crossovers between two smoothed Hull Moving Averages (HMA), allowing the indicator to detect potential reversals with minimal lag.
Once a shift is detected:
A dashed horizontal Market Shift Level is plotted at the low (for bullish shift) or high (for bearish shift) of the candle.
These levels often become key reaction points during pullbacks and trend retests.
Volume or price labels are added when price wicks into these levels, helping traders gauge the strength of rejection or acceptance.
⯁ KEY FEATURES
Uses HMA-based logic to detect when price momentum shifts.
Plots clean Market Shift Levels (MSLs) that act as dynamic support and resistance.
Automatically colors bars and candles based on the price positioning relative to levels.
Labels wick-based retests with either:
Volume data of the 3-bar cluster (default).
Price level if toggled.
⯁ HOW TO USE
Look for trend shifts where the HMA crossover triggers a new level — this marks a possible structural pivot .
Use the horizontal level as a dynamic support or resistance zone — especially when price returns with wick rejections.
Watch for volume labels near the level — higher values signal stronger rejection and potential continuation.
Combine with confluence tools like Smart Money concepts or Fibonacci levels for added edge.
⯁ EXAMPLE SETUPS
After a bullish shift, wait for price to return and wick into the level — if volume spikes and candle closes strong, it’s a retest confirmation entry .
After a bearish shift, bearish wick rejections with volume may signal short re-entry zones .
⯁ CONCLUSION
The Market Shift Levels indicator offers a visual and data-backed approach to spotting trend reversals and critical retest zones. It’s a simple yet powerful tool to structure your trades around objective, repeatable market behavior — all in real-time.

📊 RSI Multi-Timeframe Dashboard by giua64)### Summary
This is an advanced dashboard that provides a comprehensive overview of market strength and momentum, based on the Relative Strength Index (RSI) analyzed across 6 different timeframes simultaneously (from 5 minutes to the daily chart).
The purpose of this script is to offer traders an immediate and easy-to-read summary of market conditions, helping to identify the prevailing trend direction, overbought/oversold levels, and potential reversals through divergence detection. All of this is available in a single panel, eliminating the need to switch timeframes on your main chart.
### Key Features
* **Multi-Timeframe Analysis:** Simultaneously monitors the 5m, 15m, 30m, 1H, 4H, and Daily timeframes.
* **Scoring System:** Each timeframe is assigned a score based on multiple RSI conditions (e.g., above/below 50, overbought/oversold status, direction) to quantify bullish or bearish strength.
* **Aggregated Signal:** The dashboard calculates a total percentage score and provides a clear summary signal: **LONG**, **SHORT**, or **WAIT**.
* **Divergence Detection:** Automatically identifies Bullish and Bearish divergences between price and RSI for each timeframe.
* **Non-Repainting Option:** In the settings, you can choose to base calculations on the close of the previous candle (`Use RSI on Closed Candle`). This ensures that past signals (like status and score) do not change, providing more reliable data for analysis.
* **Fully Customizable:** Users can modify the RSI period, overbought/oversold thresholds, divergence detection settings, and the appearance of the table.
### How to Read the Dashboard
The table consists of 6 columns, each providing specific information:
* **% (Total Score):**
* **Header:** Shows the overall strength as a percentage. A positive value indicates bullish momentum, while a negative value indicates bearish momentum. The background color changes based on intensity.
* **Rows:** Displays the numerical score for the individual timeframe.
* **RSI:**
* **Header:** The background color indicates the average of all RSI values. Green if the average is > 50, Red if < 50.
* **Rows:** Shows the real-time RSI value for that timeframe.
* **Signal (Status):**
* **Header:** This is the final operational signal. It turns **🟢 LONG** when bullish strength is high, **🔴 SHORT** when bearish strength is high, and **⚪ WAIT** in neutral conditions.
* **Rows:** Describes the RSI status for that timeframe (e.g., Bullish, Bearish, Overbought, Oversold).
* **Dir (Direction):**
* **Header:** Displays an arrow representing the majority direction across all timeframes.
* **Rows:** Shows the instantaneous direction of the RSI (↗️ for rising, ↘️ for falling).
* **Diverg (Divergence):**
* Indicates if a bullish (`🟢 Bull`) or bearish (`🔴 Bear`) divergence has been detected on that timeframe.
* **TF (Timeframe):**
* Indicates the reference timeframe for that row.
### Advantages and Practical Use
This tool was created to solve a common problem: the need to analyze multiple charts to understand the bigger picture. With this dashboard, you can:
1. **Confirm a Trend:** A predominance of green and a "LONG" signal provides strong confirmation of bullish sentiment.
2. **Identify Weakness:** Red signals on higher timeframes can warn of an impending loss of momentum.
3. **Spot Turning Points:** A divergence on a major timeframe can signal an excellent reversal opportunity.
### Originality and Acknowledgements
This script is an original work, written from scratch by giua64. The idea was to create a comprehensive and visually intuitive tool for RSI analysis.
Any feedback, comments, or suggestions to improve the script are welcome!
**Disclaimer:** This is a technical analysis tool and should not be considered financial advice. Always do your own research and backtest any tool before using it in a live trading environment.

Step Channel Momentum Trend [ChartPrime]OVERVIEW
Step Channel Momentum Trend is a momentum-based price filtering system that adapts to market structure using pivot levels and ATR volatility. It builds a dynamic channel around a stepwise midline derived from swing highs and lows. The system colors price candles based on whether price remains inside this channel (low momentum) or breaks out (strong directional flow). This allows traders to clearly distinguish ranging conditions from trending ones and take action accordingly.
⯁ STRUCTURAL MIDLNE (STEP CHANNEL CORE)
The midline acts as the backbone of the trend system and is based on structure rather than smoothing.
Calculated as the average of the most recent confirmed Pivot High and Pivot Low.
The result is a step-like horizontal line that only updates when new pivot points are confirmed.
This design avoids lag and makes the line "snap" to recent structural shifts.
It reflects the equilibrium level between recent bullish and bearish control.
This unique step logic creates clear regime shifts and prevents noise from distorting trend interpretation.
⯁ DYNAMIC VOLATILITY BANDS (ATR FILTERING)
To detect momentum strength, the script constructs upper and lower bands using the ATR (Average True Range):
The distance from the midline is determined by ATR × multiplier (default: 200-period ATR × 0.6).
These bands adjust dynamically to volatility, expanding in high-ATR environments and contracting in calm markets.
The area between upper and lower bands represents a neutral or ranging market state.
Breakouts outside the bands are treated as significant momentum shifts.
This filtering approach ensures that only meaningful breakouts are visually emphasized — not every candle fluctuation.
⯁ MOMENTUM-BASED CANDLE COLORING
The system visually transforms price candles into momentum indicators:
When price (hl2) is above the upper band, candles are green → bullish momentum.
When price is below the lower band, candles are red → bearish momentum.
When price is between the bands, candles are orange → low or no momentum (range).
The candle body, wick, and border are all colored uniformly for visual clarity.
This gives traders instant feedback on when momentum is expanding or fading — ideal for breakout, pullback, or trend-following strategies.
⯁ PIVOT-BASED SWING ANCHORS
Each confirmed pivot is plotted as a label ⬥ directly on the chart:
They also serve as potential manual entry zones, SL/TP anchors, or confirmation points.
⯁ MOMENTUM STATE LABEL
To reinforce the current market mode, a live label is displayed at the most recent candle:
Displays either:
“ Momentum Up ” when price breaks above the upper band.
“ Momentum Down ” when price breaks below the lower band.
“ Range ” when price remains between the bands.
Label color matches the candle color for quick identification.
Automatically updates on each bar close.
This helps discretionary traders filter trades based on market phase.
USAGE
Use the green/red zones to enter with momentum and ride trending moves.
Use the orange zone to stay out or fade ranges.
The step midline can act as a breakout base, pullback anchor, or bias reference.
Combine with other indicators (e.g., order blocks, divergences, or volume) to build high-confluence systems.
CONCLUSION
Step Channel Momentum Trend gives traders a clean, adaptive framework for identifying trend direction, volatility-based breakouts, and ranging environments — all from structural logic and ATR responsiveness. Its stepwise midline provides clarity, while its dynamic color-coded candles make momentum shifts impossible to miss. Whether you’re scalping intraday momentum or managing swing entries, this tool helps you trade with the market’s rhythm — not against it.

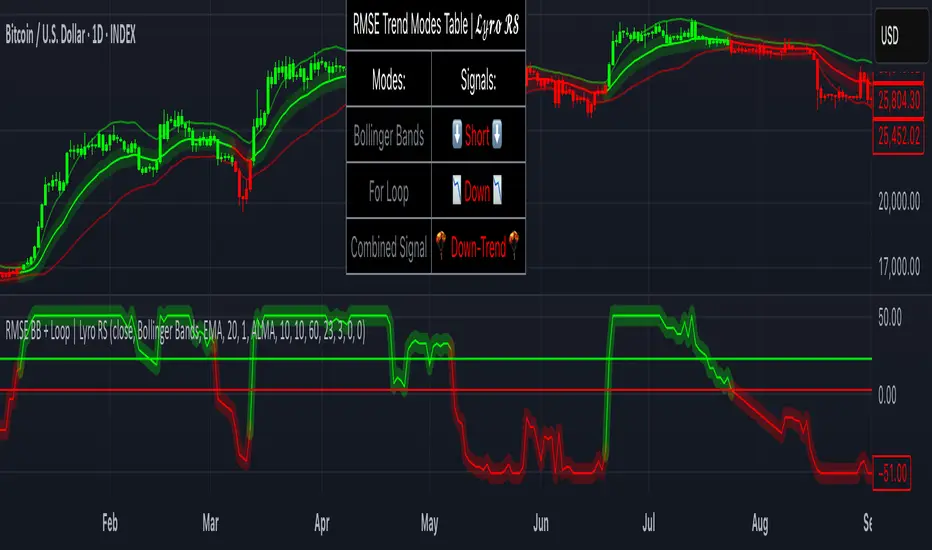
RMSE Bollinger Bands + Loop | Lyro RSRMSE Bollinger Bands + Loops
Overview
The RMSE Bollinger Bands + Loops is a sophisticated technical analysis tool designed to identify and quantify market trends by combining dynamic moving averages with statistical measures. This indicator employs a multi-model approach, integrating Bollinger-style RMSE bands, momentum scoring, and a hybrid signal system to provide traders with adaptive insights across varying market conditions.
Indicator Modes
Bollinger-style RMSE Bands: this mode calculates dynamic volatility bands around the price using the following formula:
Upper Band = Dynamic Moving Average + (RMSE × Multiplier)
Lower Band = Dynamic Moving Average - (RMSE × Multiplier)
These bands adjust to market volatility, helping identify potential breakout or breakdown points.
For-Loop Momentum Scoring, momentum is assessed by analyzing recent price behavior through a looping mechanism. A rising momentum score indicates increasing bullish strength, while a declining score suggests growing bearish momentum.
Hybrid Combined Signal: this mode assigns a directional score to the other two modes:
+1 for bullish (green)
–1 for bearish (red)
An average of these scores is computed to generate a combined signal, offering a consolidated market trend indication.
Practical Application
Signal Interpretation: A buy signal is generated when both the RMSE Bands and For-Loop Momentum Scoring align bullishly. Conversely, a sell signal is indicated when both are bearish.
Trend Confirmation: The Hybrid Combined Signal provides a consolidated view, assisting traders in confirming the prevailing market trend.
Note: Always consider additional technical analysis tools and risk management strategies when making trading decisions.
⚠️Disclaimer
This indicator is a tool for technical analysis and does not provide guaranteed results. It should be used in conjunction with other analysis methods and proper risk management practices. The creators of this indicator are not responsible for any financial decisions made based on its signals.
cd_cisd_market_CxHi Traders,
Overview:
Many traders follow market structure to identify the market direction and seek trade opportunities in line with the trend.
However, markings derived from user-defined inputs can create different structures, depending on personal choices. For instance, choosing a pivot distance of 3 instead of 2 alters the structure, even though the chart remains the same. Ideally, the structure should remain consistent.
"Change in State Delivery" ( CISD ) is a widely accepted concept among traders and is considered a significant indicator of market direction based on the gain/loss of CISD levels.
In this indicator, CISD is selected as the primary criterion for marking market structure, eliminating the influence of user-dependent variations.
Here is a summary of the key logic and rules applied:
• When the price forms a new high/low, that level is only considered a pivot if a CISD has occurred.
• A bullish CISD is always followed by a bearish CISD, and vice versa.
• Pivot points form the internal structure.
• The internal structure is used to interpret the swing structure.
• Probabilities are derived from internal structure patterns.
________________________________________
Details:
How is CISD determined?
As is commonly known:
• When price makes a new high, the opening level of the first candle in the consecutive bullish candle sequence is marked.
• When price makes a new low, the opening of the first candle in the consecutive bearish sequence is marked.
• If there’s only one candle in the sequence, its opening level is used.
In a bullish market, losing a bearish CISD level (i.e., a close below it) or in a bearish market, gaining a bullish CISD level (i.e., a close above it) is interpreted as a potential shift in buyer-seller dominance and a possible market reversal.
________________________________________
How are internal (pivot) levels determined?
• When price closes below a bearish CISD level, the highest candle's high becomes a pivot high (PH).
• When price closes above a bullish CISD level, the lowest candle's low becomes a pivot low (PL).
• If the new PH is above the previous PH, it’s labeled as HH (Higher High); otherwise, LH (Lower High).
• If the new PL is below the previous PL, it’s labeled as LL (Lower Low); otherwise, HL (Higher Low).
________________________________________
Internal Market Structure:
• A series of HHs indicates a bullish internal structure.
• A series of LLs indicates a bearish internal structure.
________________________________________
Swing (Main) Market Structure:
Using internal pivots and previous swing levels, the main market structure is derived.
• A new swing high (SH) requires the price to move above the previous SH.
• A new swing low (SL) requires the price to move below the previous SL.
________________________________________
Probability Calculation:
Pivot levels forming the internal structure are coded as five-element sequences.
There are 64 possible combinations of such sequences made from consecutive PH and PL values.
Each pattern’s frequency from its starting candle is tracked.
To make it more understandable:
For example, after the four-sequence “HH, LL, LH,HL”, either HH or LH might follow.
The table shows the statistical likelihood of both possible outcomes for the most recent four-element sequence on the chart.
________________________________________
How reliable is it?
To assess reliability, results are calculated from the beginning using:
Success Rate (Suc. Rt) = Number of Correct Predictions / Total Predictions
This value is added to the table for reference.
It’s important to note that no statistical outcome guarantees certainty—every result offers a different interpretation. What truly matters is to avoid getting stopped out 😊.
________________________________________
Menu Options:
Show/hide preferences and color selections can be customized via the indicator menu.
________________________________________
What’s Coming in Future Versions?
Features such as FVG (Fair Value Gaps) between swing levels, volume imbalances, order blocks / mitigation blocks, Fibonacci levels, and relevant trade suggestions will be added.
________________________________________
This is a BETA version that I believe will help simplify your market reading. I’d be happy to hear your feedback and suggestions.
Cheerful Trading!

Trend Blend
Trend blend is my new indicator. I use it to identify my bias when trading and filter out fake setups that are going in the wrong direction.
Trend blend utilises the 9 EMA (Red), 21 EMA (Black), and if you trade futures or Bitcoin, you can also use the VWAP (Blue).
There is also a table at the top right that displays the chart time frame bias
I prefer to use the 1-hour time frame for bias and execute the trades on 5-minute charts, mainly, and sometimes on the 1-minute for a smaller stoploss.
Here's an example of the trade I took during the London session on XAU/USD
1 hour bias was Bearish
Price broke out of the range
I waited for the London session to open, where I ended up taking a short on the 5-minute time frame as we broke out of the pre-London range
Entry was at the Fair Value Gap (5-minute bias was also Bearish as price traded into the FVG)
Stoploss was at the last high
Take Profit was the next major support level
Another set that I like to trade with the Trend blend is when price is trending bullish and price trades inside the 9 and 21 EMA, and there is a bullish candle closer above the 9 EMA with Stoploss below the low of the bullish candle and Take profit between 1-2 Risk to Reward
Same when there's a bearish trend, I wait for price to trade inside the 9 and 21 EMA, and I'll take sells when a bearish candle closes below the 9 EMA.
This setup works best in strong trends, or it can be used to enter a trade on a pullback or to scale into an existing trade.

Consolidation Zones[RanaAlgo]Overview
This indicator helps traders identify price consolidation zones (ranges) and potential breakouts in the market. It is useful for spotting periods of low volatility before significant price movements.
How It Works
Detects Consolidation Zones
Uses the ADX (Average Directional Index) to determine when the market is in a consolidation phase .
When ADX is below the threshold , the indicator marks the start of a consolidation zone.
Draws a semi-transparent box around the price range, adjusting its height as new highs/lows form.
Tracks Breakouts
When price breaks above/below the consolidation box, it signals a potential trend continuation.
Displays breakout arrows/labels (configurable shape & style) when price exits the range.
Visual Features
Boxes highlight consolidation areas (customizable color, border, and style).
Labels show real-time status ("CONSOLIDATING" or "TRENDING").
Breakout signals appear as arrows or shapes (up/down).
Usefulness in Trading
Range Trading: Helps traders identify sideways markets for buying low and selling high.
Breakout Trading: Signals potential trend entries when price exits consolidation.
Trend Confirmation: Low ADX + consolidation box = weak trend; breakout = possible trend start.
Example: If price stays in a blue box (consolidation) and then breaks above with an arrow, it suggests a bullish move.

RSI Buy Sell Signals+ with MFI Cloud [RanaAlgo]Indicator Overview
This indicator combines RSI (Relative Strength Index) with MFI (Money Flow Index) to generate trading signals with additional confirmation filters. The key features include:
RSI Analysis (14-period) with overbought/oversold levels
MFI Cloud (20-period default) showing trend direction via EMAs
Enhanced Signal Generation with volume and trend confirmation options
Visual Elements including colored zones, signal labels, and an information panel
How to Use This Indicator
Basic Interpretation:
Buy Signals (green labels) appear when:
RSI crosses above oversold level (30) OR
RSI shows a rising pattern from oversold zone with volume/trend confirmation (if enabled)
Sell Signals (red labels) appear when:
RSI crosses below overbought level (70) OR
RSI shows a falling pattern from overbought zone with volume/trend confirmation (if enabled)
MFI Cloud provides trend confirmation:
Green cloud = bullish trend (fast EMA > slow EMA)
Red cloud = bearish trend (fast EMA < slow EMA)
Recommended Usage:
For Conservative Trading:
Enable both volume and trend confirmation
Require MFI cloud to align with signal direction
Wait for RSI to clearly exit overbought/oversold zones
For Active Trading:
Combine with price action at key support/resistance levels
Watch for divergence between price and RSI
The Information Panel (top-right) shows:
Current RSI value and status
MFI trend direction
Last generated signal
Current momentum
Customization Options:
Adjust RSI/MFI lengths for sensitivity
Modify overbought/oversold levels
Toggle volume/trend confirmation requirements
Adjust visual elements like cloud opacity and zone visibility

MACD Support and Resistance [ChartPrime]⯁ OVERVIEW
MACD Support and Resistance is a dynamic support/resistance mapping tool powered by MACD crossover logic. Each time the MACD line crosses the signal line, the indicator scans for recent price extremes and locks them in as potential support or resistance zones. These levels are automatically cleaned up if price breaks them, keeping the chart focused on active market structure. The system includes a built-in MACD display with visual markers, along with contextual highs and lows to help define the current environment.
⯁ MACD-BASED SUPPORT/RESISTANCE GENERATION
The core logic uses the MACD oscillator crossover as a trigger event to generate structural levels:
When MACD crosses above its signal line:
→ The script scans the last 5 bars for the lowest low .
→ A support level is plotted at that price.
When MACD crosses below its signal line:
→ The script scans the last 5 bars for the highest high .
→ A resistance level is plotted at that price.
These dynamic levels reflect where price recently reversed or paused, making them prime zones for reaction, continuation, or invalidation.
⯁ LEVEL MANAGEMENT AND VALIDATION
To keep the chart clean and relevant:
A maximum of 20 active levels are allowed at once.
Older levels are automatically removed if the list exceeds the limit.
If price closes below a support level or above a resistance level , the corresponding line is deleted.
This ensures that only currently respected levels remain on the chart — a major advantage for active traders.
⯁ MACD VISUALIZATION + SIGNAL MARKERS
A full MACD system is rendered on the lower panel for visual confirmation:
The MACD line and Signal line are both plotted and color-coded dynamically.
A filled area] highlights the spread between them to emphasize momentum strength.
A diamond marker is drawn each time MACD crosses its signal line, alerting traders to potential trend shifts.
These visuals make it easy to understand the timing of the support/resistance updates.
⯁ LOCAL EXTREME REFERENCE LINES
To help contextualize current price position relative to recent market extremes:
A Local High line is plotted based on the highest MACD value over the past 100 bars].
A Local Low line is plotted based on the lowest MACD value over the past 100 bars].
These levels are rendered lightly and serve as dynamic range boundaries.
They assist traders in identifying overextended or compressed MACD behavior.
⯁ USAGE
Use the generated S/R levels as breakout or reversal zones.
Watch for MACD diamond markers to confirm the timing of new levels.
Combine these reactive zones with other ChartPrime confluence tools for higher-confidence entries.
Use the Local High/Low zones as a volatility envelope to guide risk and trend continuation potential.
⯁ CONCLUSION
MACD Support and Resistance takes a classic momentum indicator and adds real-time structural awareness. By linking MACD crossover events to recent price extremes, it identifies the zones where market sentiment shifted — and continues to monitor their strength. Whether you're a breakout trader or looking to fade key reaction points, this tool delivers clean, actionable levels based on momentum and structure — not guesswork.

ATR RopeATR Rope is inspired by DonovanWall's "Range Filter". It implements a similar concept of filtering out smaller market movements and adjusting only for larger moves. In addition, this indicator goes one step deeper by producing actionable zones to determine market state. (Trend vs. Consolidation)
> Background
When reading up on the Range Filter indicator, it reminded me exactly of a Rope stabilization drawing tool in a program I use frequently. Rope stabilization essentially attaches a fixed length "rope" to your cursor and an anchor point (Brush). As you move your cursor, you are pulling the brush behind it. The cursor (of course) will not pull the brush until the rope is fully extended, this behavior filters out jittery movements and is used to produce smoother drawing curves.
If compared visually side-by-side, you will notice that this indicator bears striking resemblance to its inspiration.
> Goal
Other than simply distinguishing price movements between meaningful and noise, this indicator strives to create a rigid structure to frame market movements and lack-there-of, such as when to anticipate trend, and when to suspect consolidation.
Since the indicator works based on an ATR range, the resulting ATR Channel does well to get reactions from price at its extremes. Naturally, when consolidating, price will remain within the channel, neither pushing the channel significantly up or down. Likewise, when trending, price will continue to push the channel in a single direction.
With the goal of keeping it quick and simple, this indicator does not do any smoothing of data feeds, and is simply based on the deviation of price from the central rope. Adjusting the rope when price extends past the threshold created by +/- ATR from the rope.
> Features & Behaviors
- ATR Rope
ATR Rope is displayed as a 3 color single line.
This can be considered the center line, or the directional line, whichever you'd prefer.
The main point of the Rope display is to indicate direction, however it also is factually the center of the current working range.
- ATR Rope Color
When the rope's value moves up, it changes to green (uptrend), when down, red (downtrend).
When the source crosses the rope, it turns blue (flat).
With these simple rules, we've formed a structure to view market movements.
- Consolidation Zones
Consolidation Zones generate from "Flat" areas, and extend into subsequent trend areas. Consolidation is simply areas where price has crossed the Rope and remains inside the range. Over these periods, the upper and lower values are accumulated and averaged together to form the "Consolidation Zone" values. These zones are draw live, so values are averaged as the flat areas progress and don't repaint, so all values seen historically are as they would appear live.
- ATR Channel
ATR Channel displays the upper and lower bounds of the working range.
When the source moves beyond this range, the rope is adjusted based on the distance from the source to the channel. This range can be extremely useful to view, but by default it is hidden.
> Application
This indicator is not created to provide signals, or serve as a "complete" system.
(People who didn't read this far will still comment for signals. :) )
This is created to be used alongside manual interpretation and intuition. This indicator is not meant to constrain any users into a box, and I would actually encourage an open mind and idea generation, as the application of this indicator can take various forms.
> Examples
As you would probably already know, price movement can be fast impulses, and movement can be slow bleeds. In the screenshot below, we are using movements from and to consolidation zones to classify weak trend and strong trend. As you can see, there are also areas of consolidation which get broken out of and confirmed for the larger moves.
Author's Note: In each of these examples, I have outlined the start and end of each session. These examples come from 1 Min Future charts, and have specifically been framed with day trading in mind.
"Breakout Retest" or "Support/Resistance Flips" or "Structure Retests" are all generally the same thing, with different traders referring to them by different names, all of which can be seen throughout these examples.
In the next example, we have a day which started with an early reversal leading into long, slow, trend. Notice how each area throughout the trend essentially moves slightly higher, then consolidates while holding support of the previous zone. This day had a few sharp movements, however there was a large amount of neutrality throughout this day with continuous higher lows.
In contrast to the previous example, next up, we have a very choppy day. Throughout which we see a significant amount of retests before fast directional movements. We also see a few examples of places where previous zones remained relevant into the future. While the zones only display into the resulting trend area, they do not become immediately meaningless once they stop drawing.
> Abstract
In the screenshot below, I have stacked 2 of these indicators, using the high as the source for one and the low as the source for the other. I've hidden lines of the high and low channels to create a 4 lined channel based on the wicks of price.
This is not necessary to use the indicator, but should help provide an idea of creative ways the simple indicator could be used to produce more complicated analysis.
If you've made it this far, I would hope it's clear to you how this indicator could provide value to your trading.
Thank you to DonovonWall for the inspiration.
Enjoy!

Volume Momentum [BackQuant]Volume Momentum
The Volume Momentum indicator is designed to help traders identify shifts in market momentum based on volume data. By analyzing the relative volume momentum, this indicator provides insights into whether the market is gaining strength (uptrend) or losing momentum (downtrend). The strategy uses a combination of percentile-based volume normalization, weighted moving averages (WMA), and exponential moving averages (EMA) to assess volume trends.
The system focuses on the relationship between price and volume, utilizing normalized volume data to highlight key market changes. This approach allows traders to focus on volume-driven price movements, helping them to capture momentum shifts early.
Key Features
1. Volume Normalization and Percentile Calculation:
The signed volume (positive when the close is higher than the open, negative when the close is lower) is normalized against the rolling average volume. This normalized volume is then subjected to a percentile interpolation, allowing for a robust statistical measure of how the current volume compares to historical data. The percentile level is customizable, with 50 representing the median.
2. Weighted and Smoothed Moving Averages for Trend Detection:
The normalized volume is smoothed using weighted moving averages (WMA) and exponential moving averages (EMA). These smoothing techniques help eliminate noise, providing a clearer view of the underlying momentum. The WMA filters out short-term fluctuations, while the EMA ensures that the most recent data points have a higher weight, making the system more responsive to current market conditions.
3. Trend Reversal Detection:
The indicator detects momentum shifts by evaluating whether the volume momentum crosses above or below zero. A positive volume momentum indicates a potential uptrend, while a negative momentum suggests a possible downtrend. These trend reversals are identified through crossover and crossunder conditions, triggering alerts when significant changes occur.
4. Dynamic Trend Background and Bar Coloring:
The script offers customizable background coloring based on the trend direction. When volume momentum is positive, the background is colored green, indicating a bullish trend. When volume momentum is negative, the background is colored red, signaling a bearish trend. Additionally, the bars themselves can be colored based on the trend, further helping traders quickly visualize market momentum.
5. Alerts for Momentum Shifts:
The system provides real-time alerts for traders to monitor when volume momentum crosses a critical threshold (zero), signaling a trend reversal. The alerts notify traders when the market momentum turns bullish or bearish, assisting them in making timely decisions.
6. Customizable Parameters for Flexible Usage:
Users can fine-tune the behavior of the indicator by adjusting various parameters:
Volume Rolling Mean: The period used to calculate the average volume for normalization.
Percentile Interpolation Length: Defines the range over which the percentile is calculated.
Percentile Level: Determines the percentile threshold (e.g., 50 for the median).
WMA and Smoothing Periods: Control the smoothing and response time of the indicator.
7. Trend Background Visualization and Trend-Based Bar Coloring:
The background fill is shaded according to whether the volume momentum is positive or negative, providing a visual cue to indicate market strength. Additionally, bars can be color-coded to highlight the trend, making it easier to see the trend’s direction without needing to analyze numerical data manually.
8. Note on Mean-Reversion Strategy:
If you take the inverse of the signals, this indicator can be adapted for a mean-reversion strategy. Instead of following the trend, the strategy would involve buying assets that are underperforming and selling assets that are overperforming, based on volume momentum. However, it’s important to note that this approach may not work effectively on highly correlated assets, as their price movements may be too similar, reducing the effectiveness of the mean-reversion strategy.
Final Thoughts
The Volume Momentum indicator offers a comprehensive approach to analyzing volume-based momentum shifts in the market. By using volume normalization, percentile interpolation, and smoothed moving averages, this system helps identify the strength and direction of market trends. Whether used for trend-following or adapted for mean-reversion, this tool provides traders with actionable insights into the market’s volume-driven movements, improving decision-making and portfolio management.

LRCLRC (Linear Regression Candle)
Overview
The LRC (Linear Regression Candle) indicator applies linear regression to the open, high, low, and close prices, creating smoothed "candles" that help filter market noise. It provides trend-confirmation signals and highlights potential reversal points based on regression crossovers.
Key Features
Smoothed Candles: Uses linear regression to calculate synthetic OHLC values, reducing noise.
Multi-Timeframe Support: Optional higher timeframe analysis for better trend confirmation.
Visual Signals: Color-coded candles and labels highlight bullish/bearish control zones.
Customizable Settings: Adjustable regression length, colors, and timeframe options.
How to Use
Signals & Interpretation
🟢 Bullish Signal (BUY): When the regression open crosses above the regression close (green candle).
🔴 Bearish Signal (SELL): When the regression open crosses below the regression close (red candle).
Control Zones:
Strong Bullish (Controlbull): Confirmed uptrend (bright green).
Bullish (Bull): Regular uptrend (light green).
Strong Bearish (Controlbear): Confirmed downtrend (dark red).
Bearish (Bear): Regular downtrend (orange).
Neutral (Gray): No clear trend.
Recommended Settings
Linear Regression Length: Default 8 (adjust for sensitivity).
Timeframe: Default current chart, but can switch to higher timeframes (e.g., 1D, 1W).
Bar Colors: Toggle on/off for visual clarity.
Labels: Displays "Control" markers at key reversal points.
Example Use Cases
Trend Confirmation: Use higher timeframe LRC to validate the primary trend.
Reversal Signals: Watch for BUY/SELL crossovers with strong color confirmation.
Noise Reduction: Helps avoid false breakouts in choppy markets.

FVG Trailing Stop [LuxAlgo]The FVG Trailing Stop indicator tracks unmitigated Fair Value Gaps (FVG) data to produce a Trailing Stop indicator able to determine if the market is uptrending or downtrending easily.
🔶 USAGE
The FVG Trailing Stop is intended to identify trend directions through its position relative to the closing price:
Bullish: Price is located above the Trailing Stop, indicating that all Bearish FVGs have been mitigated and the trend is anticipated to continue upwards.
Bearish State: Price is located below the Trailing Stop, indicating that all Bullish FVGs have been mitigated and the trend is anticipated to continue downwards.
The Trailing Stop originates from two extremities obtained from the average of respective unmitigated FVGs. The specific directional average is also displayed as a more transparent secondary line, however, the trailing stop is derived from this value and a new trend will not be detected until the opposite directional average is crossed.
Price reaching the Trailing Stop is caused by retracements and can lead to the following scenarios:
Outcome 1: The directional average is crossed next, indicating a new trend direction.
Outcome 2: The directional average is held as support or resistance, leading to a new impulse and a continuation of the trend.
🔹 Reset on Cross
While price crossing the Trailing Stop should be considered as a sign of an upcoming trend change; it is possible for the price to still evolve outside it.
As a solution, we have included the "Reset on Cross" feature, which (as the name suggests) hides and resets the Trailing Stop each time it is crossed, leading to a "Neutral" state.
This opens the opportunity for the Trailing Stop to be displayed again once the price moves again in the direction of the pre-established trend. A trader might use this to accumulate positions within a specific trend.
🔶 DETAILS
The script uses a typical identification method for FVGs. Once identified, the script collects the point of the FVG farthest from the current price when formed.
For Upwards FVGs this is the bottom of the FVG.
For Downwards FVGs this is the top of the FVG.
The data is managed only to use the last input lookback of FVGs. If an FVG is mitigated, it frees up a spot in the memory for a new FVG, however, if the lookback is full, the oldest will be deleted.
From there, it uses a "trailing" logic only to move the Trailing Stop in one direction until the trailing stop resets or the direction flips.
The extremities used to calculate the Trailing Stop are created from 2 calculation steps, the first step involves taking the raw average of the FVG mitigation levels, and the second step applies a simple moving average (SMA) smoothing of the precedent-obtained averages.
🔶 SETTINGS
Unmitigated FVG Lookback: Sets the maximum number of Unmitigated FVGs that the script will use.
Smoothing Length: Sets the smoothing length for the Trailing Stop to reduce erratic results.
Reset on Cross: When enabled, hide and reset the Trailing Stop until the price starts moving in the pre-established trend direction again.

RSI-Adaptive T3 [ChartPrime]The RSI-Adaptive T3 is a precision trend-following tool built around the legendary T3 smoothing algorithm developed by Tim Tillson , designed to enhance responsiveness while reducing lag compared to traditional moving averages. Current implementation takes it a step further by dynamically adapting the smoothing length based on real-time RSI conditions — allowing the T3 to “breathe” with market volatility. This dynamic length makes the curve faster in trending moves and smoother during consolidations.
To help traders visualize volatility and directional momentum, adaptive volatility bands are plotted around the T3 line, with visual crossover markers and a dynamic info panel on the chart. It’s ideal for identifying trend shifts, spotting momentum surges, and adapting strategy execution to the pace of the market.
HOIW IT WORKS
At its core, this indicator fuses two ideas:
The T3 Moving Average — a 6-stage recursively smoothed exponential average created by Tim Tillson , designed to reduce lag without sacrificing smoothness. It uses a volume factor to control curvature.
A Dynamic Length Engine — powered by the RSI. When RSI is low (market oversold), the T3 becomes shorter and more reactive. When RSI is high (overbought), the T3 becomes longer and smoother. This creates a feedback loop between price momentum and trend sensitivity.
// Step 1: Adaptive length via RSI
rsi = ta.rsi(src, rsiLen)
rsi_scale = 1 - rsi / 100
len = math.round(minLen + (maxLen - minLen) * rsi_scale)
pine_ema(src, length) =>
alpha = 2 / (length + 1)
sum = 0.0
sum := na(sum ) ? src : alpha * src + (1 - alpha) * nz(sum )
sum
// Step 2: T3 with adaptive length
e1 = pine_ema(src, len)
e2 = pine_ema(e1, len)
e3 = pine_ema(e2, len)
e4 = pine_ema(e3, len)
e5 = pine_ema(e4, len)
e6 = pine_ema(e5, len)
c1 = -v * v * v
c2 = 3 * v * v + 3 * v * v * v
c3 = -6 * v * v - 3 * v - 3 * v * v * v
c4 = 1 + 3 * v + v * v * v + 3 * v * v
t3 = c1 * e6 + c2 * e5 + c3 * e4 + c4 * e3
The result: an evolving trend line that adapts to market tempo in real-time.
KEY FEATURES
⯁ RSI-Based Adaptive Smoothing
The length of the T3 calculation dynamically adjusts between a Min Length and Max Length , based on the current RSI.
When RSI is low → the T3 shortens, tracking reversals faster.
When RSI is high → the T3 stretches, filtering out noise during euphoria phases.
Displayed length is shown in a floating table, colored on a gradient between min/max values.
⯁ T3 Calculation (Tim Tillson Method)
The script uses a 6-stage EMA cascade with a customizable Volume Factor (v) , as designed by Tillson (1998) .
Formula:
T3 = c1 * e6 + c2 * e5 + c3 * e4 + c4 * e3
This technique gives smoother yet faster curves than EMAs or DEMA/Triple EMA.
⯁ Visual Trend Direction & Transitions
The T3 line changes color dynamically:
Color Up (default: blue) → bullish curvature
Color Down (default: orange) → bearish curvature
Plot fill between T3 and delayed T3 creates a gradient ribbon to show momentum expansion/contraction.
Directional shift markers (“🞛”) are plotted when T3 crosses its own delayed value — helping traders spot trend flips or pullback entries.
⯁ Adaptive Volatility Bands
Optional upper/lower bands are plotted around the T3 line using a user-defined volatility window (default: 100).
Bands widen when volatility rises, and contract during compression — similar to Bollinger logic but centered on the adaptive T3.
Shaded band zones help frame breakout setups or mean-reversion zones.
⯁ Dynamic Info Table
A live stats panel shows:
Current adaptive length
Maximum smoothing (▲ MaxLen)
Minimum smoothing (▼ MinLen)
All values update in real time and are color-coded to match trend direction.
HOW TO USE
Use T3 crossovers to detect trend transitions, especially during periods of volatility compression.
Watch for volatility contraction in the bands — breakouts from narrow band periods often precede trend bursts.
The adaptive smoothing length can also be used to assess current market tempo — tighter = faster; wider = slower.
CONCLUSION
RSI-Adaptive T3 modernizes one of the most elegant smoothing algorithms in technical analysis with intelligent RSI responsiveness and built-in volatility bands. It gives traders a cleaner read on trend health, directional shifts, and expansion dynamics — all in a visually efficient package. Perfect for scalpers, swing traders, and algorithmic modelers alike, it delivers advanced logic in a plug-and-play format.

CHN BUY SELL with EMA 200Overview
This indicator combines RSI 7 momentum signals with EMA 200 trend filtering to generate high-probability BUY and SELL entry points. It uses colored candles to highlight key market conditions and displays clear trading signals with built-in cooldown periods to prevent signal spam.
Key Features
Colored Candles: Visual momentum indicators based on RSI 7 levels
Trend Filtering: EMA 200 confirms overall market direction
Signal Cooldown: Prevents over-trading with adjustable waiting periods
Clean Interface: Simple BUY/SELL labels without clutter
How It Works
Candle Coloring System
Yellow Candles: Appear when RSI 7 ≥ 70 (overbought momentum)
Purple Candles: Appear when RSI 7 ≤ 30 (oversold momentum)
Normal Candles: All other market conditions
Trading Signals
BUY Signal: Triggered when closing price > EMA 200 AND yellow candle appears
SELL Signal: Triggered when closing price < EMA 200 AND purple candle appears
Signal Cooldown
After a BUY or SELL signal appears, the same signal type is suppressed for a specified number of candles (default: 5) to prevent excessive signals in ranging markets.
Settings
RSI 7 Length: Period for RSI calculation (default: 7)
RSI 7 Overbought: Threshold for yellow candles (default: 70)
RSI 7 Oversold: Threshold for purple candles (default: 30)
EMA Length: Period for trend filter (default: 200)
Signal Cooldown: Candles to wait between same signal type (default: 5)
How to Use
Apply the indicator to your chart
Look for yellow or purple colored candles
For LONG entries: Wait for yellow candle above EMA 200, then enter BUY when signal appears
For SHORT entries: Wait for purple candle below EMA 200, then enter SELL when signal appears
Use appropriate risk management and position sizing
Best Practices
Works best on timeframes M15 and higher
Suitable for Forex, Gold, Crypto, and Stock markets
Consider market volatility when setting stop-loss and take-profit levels
Use in conjunction with proper risk management strategies
Technical Details
Overlay: True (plots directly on price chart)
Calculation: Based on RSI momentum and EMA trend analysis
Signal Logic: Combines momentum exhaustion with trend direction
Visual Feedback: Colored candles provide immediate market condition awareness

Arnaud Legoux Trend Aggregator | Lyro RSArnaud Legoux Trend Aggregator
Introduction
Arnaud Legoux Trend Aggregator is a custom-built trend analysis tool that blends classic market oscillators with advanced normalization, advanced math functions and Arnaud Legoux smoothing. Unlike conventional indicators, 𝓐𝓛𝓣𝓐 aggregates market momentum, volatility and trend strength.
Signal Insight
The 𝓐𝓛𝓣𝓐 line visually reflects the aggregated directional bias. A rise above the middle line threshold signals bullish strength, while a drop below the middle line indicates bearish momentum.
Another way to interpret the 𝓐𝓛𝓣𝓐 is through overbought and oversold conditions. When the 𝓐𝓛𝓣𝓐 rises above the +0.7 threshold, it suggests an overbought market and signals a strong uptrend. Conversely, a drop below the -0.7 level indicates an oversold condition and a strong downtrend.
When the oscillator hovers near the zero line, especially within the neutral ±0.3 band, it suggests that no single directional force is dominating—common during consolidation phases or pre-breakout compression.
Real-World Example
Usually 𝓐𝓛𝓣𝓐 is used by following the bar color for simple signals; however, like most indicators there are unique ways to use an indicator. Let’s dive deep into such ways.
The market begins with a green bar color, raising awareness for a potential long setup—but not a direct entry. In this methodology, bar coloring serves as an alert mechanism rather than a strict entry trigger.
The first long position was initiated when the 𝓐𝓛𝓣𝓐 signal line crossed above the +0.3 threshold, suggesting a shift in directional acceleration. This entry coincided with a rising price movement, validating the trade.
As price advanced, the position was exited into cash—not reversed into a short—because the short criteria for this use case are distinct. The exit was prompted by 𝓐𝓛𝓣𝓐 crossing back below the +0.3 level, signaling the potential weakening of the long trend.
Later, as 𝓐𝓛𝓣𝓐 crossed below 0, attention shifted toward short opportunities. A short entry was confirmed when 𝓐𝓛𝓣𝓐 dipped below -0.3, indicating growing downside momentum. The position was eventually closed when 𝓐𝓛𝓣𝓐 crossed back above the -0.3 boundary—signaling a possible deceleration of the bearish move.
This logic was consistently applied in subsequent setups, emphasizing the role of 𝓐𝓛𝓣𝓐’s thresholds in guiding both entries and exits.
Framework
The Arnaud Legoux Trend Aggregator (ALTA) combines multiple technical indicators into a single smoothed signal. It uses RSI, MACD, Bollinger Bands, Stochastic Momentum Index, and ATR.
Each indicator's output is normalized to a common scale to eliminate bias and ensure consistency. These normalized values are then transformed using a hyperbolic tangent function (Tanh).
The final score is refined with a custom Arnaud Legoux Moving Average (ALMA) function, which offers responsive smoothing that adapts quickly to price changes. This results in a clear signal that reacts efficiently to shifting market conditions.
⚠️ WARNING ⚠️: THIS INDICATOR, OR ANY OTHER WE (LYRO RS) PUBLISH, IS NOT FINANCIAL OR INVESTMENT ADVICE. EVERY INDICATOR SHOULD BE COMBINED WITH PRICE ACTION, FUNDAMENTALS, OTHER TECHNICAL ANALYSIS TOOLS & PROPER RISK. MANAGEMENT.

Gann Swing PointsIndicator Logic
This is a GANN-style swing indicator that classifies bars based on their high/low structure relative to the previous bar.
I strongly encourage you to replay bars on Tradingview using this indicator to get a sense of how it creates pivot (or swing) points
Bar Classification:
Up-Bar (direction: 'up'): Higher High and Higher Low (HH/HL)
Down-Bar (direction: 'down'): Lower High and Lower Low (LH/LL)
Outside-Bar (generates 2 directions):
Green: 'down' then 'up'
Red: 'up' then 'down'
Inside-Bar: No direction generated (HL/LH)
Swing Line Logic
The swing line continues in the current direction until n opposite directions are detected.
n is the "n-direction" parameter (commonly set to 2, so 2 consecutive opposite direction is needed to turn the swing)
When n opposing directions occur, the swing turns, creating a pivot point
Inside bar is ignored, so e.g up-bar -> inside-bar -> up-bar generates "up", "up" direction
A top pivot is formed when the swing turns down
A bottom pivot is formed when it turns up
Note: This swing logic is inherently lagging — it only confirms tops/bottoms after the fact
This swing structure gives the system a clear and noise-resistant way to identify pivot points (swing-points)

Enhanced Stock Ticker with 50MA vs 200MADescription
The Enhanced Stock Ticker with 50MA vs 200MA is a versatile Pine Script indicator designed to visualize the relative position of a stock's price within its short-term and long-term price ranges, providing actionable bullish and bearish signals. By calculating normalized indices based on user-defined lookback periods (defaulting to 50 and 200 bars), this indicator helps traders identify potential reversals or trend continuations. It offers the flexibility to plot signals either on the main price chart or in a separate lower pane, leveraging Pine Script v6's force_overlay functionality for seamless integration. The indicator also includes a customizable ticker table, visual fills, and alert conditions for automated trading setups.
Key Features
Dual Lookback Indices: Computes short-term (default: 50 bars) and long-term (default: 200 bars) indices, normalizing the closing price relative to the high/low range over the specified periods.
Flexible Signal Plotting: Users can toggle between plotting crossover signals (triangles) on the main price chart (location.abovebar/belowbar) or in the lower pane (location.top/bottom) using the Plot Signals on Main Chart option.
Crossover Signals: Generates bullish (Golden Cross) and bearish (Death Cross) signals when the short or long index crosses above 5 or below 95, respectively.
Visual Enhancements:
Plots short-term (blue) and long-term (white) indices in a separate pane with customizable lookback periods.
Includes horizontal reference lines at 0, 20, 50, 80, and 100, with green and red fills to highlight overbought/oversold zones.
Dynamic fill between indices (green when short > long, red when long > short) for quick trend visualization.
Displays a ticker and legend table in the top-right corner, showing the symbol and lookback periods.
Alert Conditions: Supports alerts for bullish and bearish crossovers on both short and long indices, enabling integration with TradingView's alert system.
Technical Innovation: Utilizes Pine Script v6's force_overlay parameter to plot signals on the main chart from a non-overlay indicator, combining the benefits of a separate pane and chart-based signals in a single script.
Technical Details
Calculation Logic:
Uses confirmed bars (barstate.isconfirmed) to calculate indices, ensuring reliability by avoiding real-time bar fluctuations.
Short-term index: (close - lowest(low, lookback_short)) / (highest(high, lookback_short) - lowest(low, lookback_short)) * 100
Long-term index: (close - lowest(low, lookback_long)) / (highest(high, lookback_long) - lowest(low, lookback_long)) * 100
Signals are triggered using ta.crossover() and ta.crossunder() for indices crossing 5 (bullish) and 95 (bearish).
Signal Plotting:
Main chart signals use force_overlay=true with location.abovebar/belowbar for precise alignment with price bars.
Lower pane signals use location.top/bottom for visibility within the indicator pane.
Plotting is controlled by boolean conditions (e.g., bullishLong and plot_on_chart) to ensure compliance with Pine Script's global scope requirements.
Performance Considerations: Optimized for efficiency by calculating indices only on confirmed bars and using lightweight plotting functions.
How to Use
Add to Chart:
Copy the script into TradingView's Pine Editor and add it to your chart.
Configure Settings:
Short Lookback Period: Adjust the short-term lookback (default: 50 bars) to match your trading style (e.g., 20 for shorter-term analysis).
Long Lookback Period: Adjust the long-term lookback (default: 200 bars) for broader market context.
Plot Signals on Main Chart: Check this box to display signals on the price chart; uncheck to show signals in the lower pane.
Interpret Signals:
Golden Cross (Bullish): Green (long) or blue (short) triangles indicate the index crossing above 5, suggesting a potential buying opportunity.
Death Cross (Bearish): Red (long) or white (short) triangles indicate the index crossing below 95, signaling a potential selling opportunity.
Set Alerts:
Use TradingView's alert system to create notifications for the four alert conditions: Long Index Valley, Long Index Peak, Short Index Valley, and Short Index Peak.
Customize Visuals:
The ticker table displays the symbol and lookback periods in the top-right corner.
Adjust colors and styles via TradingView's settings if desired.
Example Use Cases
Swing Trading: Use the short-term index (e.g., 50 bars) to identify short-term reversals within a broader trend defined by the long-term index.
Trend Confirmation: Monitor the fill between indices to confirm whether the short-term trend aligns with the long-term trend.
Automated Trading: Leverage alert conditions to integrate with bots or manual trading strategies.
Notes
Testing: Always backtest the indicator on your chosen market and timeframe to validate its effectiveness.
Optional Histogram: The script includes a commented-out histogram for the index difference (index_short - index_long). Uncomment the plot(index_diff, ...) line to enable it.
Compatibility: Built for Pine Script v6 and tested on TradingView as of May 27, 2025.
Acknowledgments
This indicator was inspired by the need for a flexible tool that combines lower-pane analysis with main chart signals, made possible by Pine Script's force_overlay feature. Share your feedback or suggestions in the comments below, and happy trading!

Weighted Regression Bands (Zeiierman)█ Overview
Weighted Regression Bands is a precision-engineered trend and volatility tool designed to adapt to the real market structure instead of reacting to price noise.
This indicator analyzes Weighted High/Low medians and applies user-selectable smoothing methods — including Kalman Filtering, ALMA, and custom Linear Regression — to generate a Fair Value line. Around this, it constructs dynamic standard deviation bands that adapt in real-time to market volatility.
The result is a visually clean and structurally intelligent trend framework suitable for breakout traders, mean reversion strategies, and trend-driven analysis.
█ How It Works
⚪ Structural High/Low Analysis
At the heart of this indicator is a custom high/low weighting system. Instead of using just the raw high or low values, it calculates a midline = (high + low) / 2, then applies one of three weighting methods to determine which price zones matter most.
Users can select the method using the “Weighted HL Method” setting:
Simple
Selects the single most dominant median (highest or lowest) in the lookback window. Ideal for fast, reactive signals.
Advanced
Ranks each bar based on a composite score: median × range × recency. This method highlights structurally meaningful bars that had both volatility and recency. A built-in Kalman filter is applied for extra stability.
Smooth
Blends multiple bars into a single weighted average using smoothed decay and range. This provides the softest and most stable structural response.
⚪ Smoothing Methods (ALMA / Linear Regression)
ALMA provides responsive, low-lag smoothing for fast trend reading.
Linear Regression projects the Fair Value forward, ideal for trend modeling.
⚪ Kalman Smoothing Filter
Before trend calculations, the indicator applies an optional Kalman-style smoothing filter. This helps:
Reduce choppy false shifts in trend,
Retain signal clarity during volatile periods,
Provide stability for long-term setups.
⚪ Deviation Bands (Dynamic Volatility Envelopes)
The indicator builds ±1, ±2, and ±3 standard deviation bands around the fair value line:
Calculated from the standard deviation of price,
Bands expand and contract based on recent volatility,
Visualizes potential overbought/oversold or trending conditions.
█ How to Use
⚪ Trend Trading & Filtering
Use the Fair Value line to identify the dominant direction.
Only trade in the direction of the slope for higher probability setups.
⚪ Volatility-Based Entries
Watch for price reaching outer bands (+2σ, +3σ) for possible exhaustion.
Mean reversion entries become higher quality when far from Fair Value.
█ Settings
Length – Lookback for Weighted HL and trend smoothing
Deviation Multiplier – Controls how wide the bands are from the fair value line
Method – Choose between ALMA or Linear Regression smoothing
Smoothing – Strength of Kalman Filter (1 = none, <1 = stronger smoothing)
-----------------
Disclaimer
The content provided in my scripts, indicators, ideas, algorithms, and systems is for educational and informational purposes only. It does not constitute financial advice, investment recommendations, or a solicitation to buy or sell any financial instruments. I will not accept liability for any loss or damage, including without limitation any loss of profit, which may arise directly or indirectly from the use of or reliance on such information.
All investments involve risk, and the past performance of a security, industry, sector, market, financial product, trading strategy, backtest, or individual's trading does not guarantee future results or returns. Investors are fully responsible for any investment decisions they make. Such decisions should be based solely on an evaluation of their financial circumstances, investment objectives, risk tolerance, and liquidity needs.

Volume Flow OscillatorVolume Flow Oscillator
Overview
The Volume Flow Oscillator is an advanced technical analysis tool that measures buying and selling pressure by combining price direction with volume. Unlike traditional volume indicators, this oscillator reveals the force behind price movements, helping traders identify strong trends, potential reversals, and divergences between price and volume.
Reading the Indicator
The oscillator displays seven colored bands that fluctuate around a zero line:
Three bands above zero (yellow) indicate increasing levels of buying pressure
Three bands below zero (red) indicate increasing levels of selling pressure
The central band represents the baseline volume flow
Color intensity changes based on whether values are positive or negative
Trading Signals
The Volume Flow Oscillator provides several valuable trading signals:
Zero-line crossovers: When multiple bands cross from negative to positive, potential bullish shift; opposite for bearish
Divergences: When price makes new highs/lows but oscillator bands fail to confirm, signals potential reversal
Volume climax: Extreme readings where outer bands stretch far from zero often precede reversals
Trend confirmation: Strong expansion of bands in direction of price movement confirms genuine momentum
Support/resistance: During trends, bands may remain largely on one side of zero, showing continued directional pressure
Customization
Adjust these key parameters to optimize the oscillator for your trading style:
Lookback Length: Controls overall sensitivity (shorter = more responsive, longer = smoother)
Multipliers: Adjust sensitivity spread between bands for different market conditions
ALMA Settings: Fine-tune how the indicator weights recent versus historical data
VWMA Toggle: Enable for additional smoothing in volatile markets
Best Practices
For optimal results, use this oscillator in conjunction with price action and other confirmation indicators. The multi-band approach helps distinguish between minor fluctuations and significant volume events that might signal important market turns.

Bitcoin Power LawThis is the main body version of the script. The Oscillator version can be found here.
Understanding the Bitcoin Power Law Model
Also called the Long-Term Bitcoin Power Law Model. The Bitcoin Power Law model tries to capture and predict Bitcoin's price growth over time. It assumes that Bitcoin's price follows an exponential growth pattern, where the price increases over time according to a mathematical relationship.
By fitting a power law to historical data, the model creates a trend line that represents this growth. It then generates additional parallel lines (support and resistance lines) to show potential price boundaries, helping to visualize where Bitcoin’s price could move within certain ranges.
In simple terms, the model helps us understand Bitcoin's general growth trajectory and provides a framework to visualize how its price could behave over the long term.
The Bitcoin Power Law has the following function:
Power Law = 10^(a + b * log10(d))
Consisting of the following parameters:
a: Power Law Intercept (default: -17.668).
b: Power Law Slope (default: 5.926).
d: Number of days since a reference point(calculated by counting bars from the reference point with an offset).
Explanation of the a and b parameters:
Roughly explained, the optimal values for the a and b parameters are determined through a process of linear regression on a log-log scale (after applying a logarithmic transformation to both the x and y axes). On this log-log scale, the power law relationship becomes linear, making it possible to apply linear regression. The best fit for the regression is then evaluated using metrics like the R-squared value, residual error analysis, and visual inspection. This process can be quite complex and is beyond the scope of this post.
Applying vertical shifts to generate the other lines:
Once the initial power-law is created, additional lines are generated by applying a vertical shift. This shift is achieved by adding a specific number of days (or years in case of this script) to the d-parameter. This creates new lines perfectly parallel to the initial power law with an added vertical shift, maintaining the same slope and intercept.
In the case of this script, shifts are made by adding +365 days, +2 * 365 days, +3 * 365 days, +4 * 365 days, and +5 * 365 days, effectively introducing one to five years of shifts. This results in a total of six Power Law lines, as outlined below (From lowest to highest):
Base Power Law Line (no shift)
1-year shifted line
2-year shifted line
3-year shifted line
4-year shifted line
5-year shifted line
The six power law lines:
Bitcoin Power Law Oscillator
This publication also includes the oscillator version of the Bitcoin Power Law. This version applies a logarithmic transformation to the price, Base Power Law Line, and 5-year shifted line using the formula: log10(x) .
The log-transformed price is then normalized using min-max normalization relative to the log-transformed Base Power Law Line and 5-year shifted line with the formula:
normalized price = log(close) - log(Base Power Law Line) / log(5-year shifted line) - log(Base Power Law Line)
Finally, the normalized price was multiplied by 5 to map its value between 0 and 5, aligning with the shifted lines.
Interpretation of the Bitcoin Power Law Model:
The shifted Power Law lines provide a framework for predicting Bitcoin's future price movements based on historical trends. These lines are created by applying a vertical shift to the initial Power Law line, with each shifted line representing a future time frame (e.g., 1 year, 2 years, 3 years, etc.).
By analyzing these shifted lines, users can make predictions about minimum price levels at specific future dates. For example, the 5-year shifted line will act as the main support level for Bitcoin’s price in 5 years, meaning that Bitcoin’s price should not fall below this line, ensuring that Bitcoin will be valued at least at this level by that time. Similarly, the 2-year shifted line will serve as the support line for Bitcoin's price in 2 years, establishing that the price should not drop below this line within that time frame.
On the other hand, the 5-year shifted line also functions as an absolute resistance , meaning Bitcoin's price will not exceed this line prior to the 5-year mark. This provides a prediction that Bitcoin cannot reach certain price levels before a specific date. For example, the price of Bitcoin is unlikely to reach $100,000 before 2021, and it will not exceed this price before the 5-year shifted line becomes relevant. After 2028, however, the price is predicted to never fall below $100,000, thanks to the support established by the shifted lines.
In essence, the shifted Power Law lines offer a way to predict both the minimum price levels that Bitcoin will hit by certain dates and the earliest dates by which certain price points will be reached. These lines help frame Bitcoin's potential future price range, offering insight into long-term price behavior and providing a guide for investors and analysts. Lets examine some examples:
Example 1:
In Example 1 it can be seen that point A on the 5-year shifted line acts as major resistance . Also it can be seen that 5 years later this price level now corresponds to the Base Power Law Line and acts as a major support at point B (Note: Vertical yearly grid lines have been added for this purpose👍).
Example 2:
In Example 2, the price level at point C on the 3-year shifted line becomes a major support three years later at point D, now aligning with the Base Power Law Line.
Finally, let's explore some future price predictions, as this script provides projections on the weekly timeframe :
Example 3:
In Example 3, the Bitcoin Power Law indicates that Bitcoin's price cannot surpass approximately $808K before 2030 as can be seen at point E, while also ensuring it will be at least $224K by then (point F).
