PROTECTED SOURCE SCRIPT
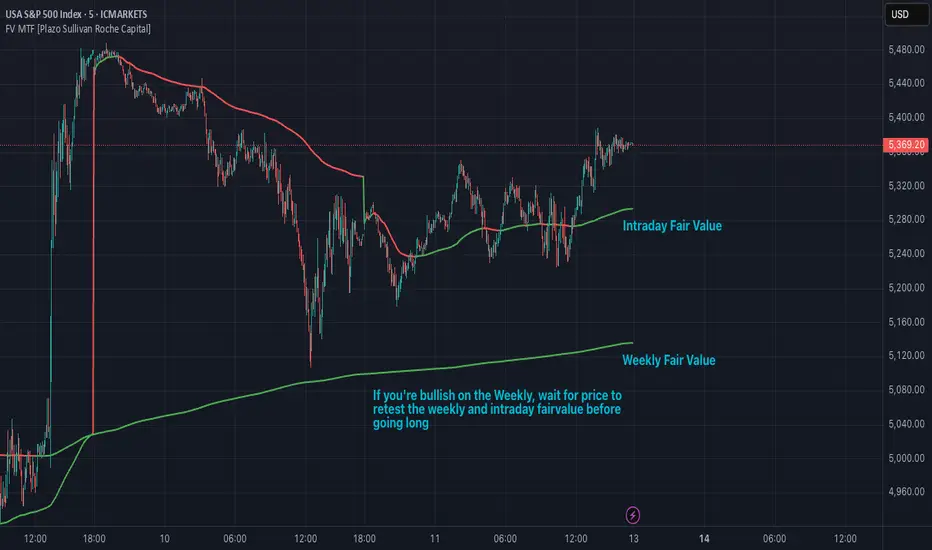
Fair Value MTF [Plazo Sullivan Roche Capital]
Unlock a New Edge in Market Timing with the Multi-Timeframe VWAP Indicator!
Transform your trading strategy with our cutting-edge TradingView indicator that brings the power of VWAP to multiple timeframes—all at your fingertips. Designed with the savvy trader in mind, this indicator gives you the clarity to see when prices stray from fair market value:
Seize the Opportunity:
When prices rise above the VWAP, it signals that the market is overvalued. This is your cue for a high-probability shorting opportunity, capitalizing on moments when excesses are primed for a pullback.
Find Your Bargain:
When prices fall below the VWAP, the market is signaling undervaluation—a perfect setup for a buying entry.
Trade with Confidence:
By aligning your trades with the prevailing weekly trend, this tool isn’t about random entries—it’s about smart, trend-confirmed retests at the VWAP. Ensure every trade is set against the direction of the broader market trend for optimized results.
Whether you’re a day trader looking for intraday signals or a swing trader aligning with the weekly momentum, our indicator streamlines your analysis and sharpens your decision-making. Elevate your trading and tap into a system built for precision and performance. Step into a new era of market analysis—where every retest is a potential win!
User Manual
1. Introduction
The Multi-Timeframe VWAP Indicator is engineered to help you interpret market sentiment and spot key entry signals by displaying customizable VWAPs from various timeframes. By highlighting moments when the price diverges from its fair value, this tool provides actionable insights to short overvalued markets and buy undervalued opportunities. Always use in conjunction with your overall market analysis and risk management protocols.
2. Understanding VWAP Basics
What is VWAP?
The Volume Weighted Average Price (VWAP) represents the average price a security has traded at throughout the day, based on both volume and price. It’s widely regarded as a benchmark for fair value.
How It Works:
Price Above VWAP: Indicates the security is trading at a premium—often a sign to consider short positions if confirmed by the weekly trend.
Price Below VWAP: Suggests the security is trading at a discount—an ideal signal for initiating a long or buying position.
Multi-Timeframe Advantage:
The indicator allows you to select VWAPs across different timeframes, offering a dynamic view that lets you align trades with the main weekly trend and pinpoint retest opportunities.
3. Installation and Setup
A. Installation Steps
Access TradingView:
Log in to your TradingView account.
Add the Indicator:
Open the “Indicators” menu on your chart.
Select “Add Script” and paste the provided code or locate the indicator by name if published publicly.
Apply the indicator to your chart.
Customizing Display Settings:
Select Timeframes: Choose which timeframe VWAPs you want displayed (e.g., intraday, daily, weekly).
Adjust Appearance: Customize line colors, thickness, and opacity through the indicator’s settings panel to match your chart style.
Set Alerts (Optional): Configure alerts when price crosses above or below a VWAP, ensuring you never miss a signal.
B. Initial Configuration Tips
Double-check that the indicator is plotting on your desired timeframes.
Familiarize yourself with the input parameters to adjust the VWAP calculations if necessary (e.g., session start/end times).
4. How to Use the Indicator
A. Interpreting Signals
Overvalued (Short Setup):
When the price moves above a selected VWAP, it indicates that the market may be overbought. Look for additional confirmation (such as alignment with the main weekly trend) before taking a short position.
Example: Price surges above the daily VWAP while the weekly trend remains bearish. This convergence signals that a pullback is likely.
Undervalued (Buy Setup):
Conversely, when the price is below the VWAP, the market is signifying a discount. This is your cue to look for buying opportunities.
Example: A dip below the daily VWAP in an overall bullish weekly trend can present a prime entry as the market is expected to recover.
Retest Strategy:
The most robust trades occur when price retests the VWAP in the direction of the main weekly trend.
Wait for a price retest of the VWAP level as confirmation.
Confirm that the retest aligns with the broader trend before entering the trade.
B. Practical Steps When Trading
Confirm the Trend:
Use other trend indicators or price action analysis to confirm the weekly market direction.
Monitor Price Action:
Observe how the price interacts with the VWAP lines. A strong retest provides confidence in your trade decision.
Execute and Manage Trades:
Enter a position when the price retests the VWAP and aligns with the trend.
Set stops just beyond the VWAP line to protect against unexpected volatility.
Consider profit-taking levels based on key support/resistance zones.
5. Advanced Features and Tips
Multi-Timeframe Analysis:
Use the indicator’s flexibility to view VWAP levels across different timeframes. This can enhance your analysis by revealing short-term versus long-term divergences.
Integrate with Other Tools:
Combine the VWAP Indicator with other technical indicators—such as moving averages or oscillators—to build a robust trading system.
Alert System:
Customize alerts for VWAP cross events. This ensures you’re immediately notified when price conditions meet your criteria.
Paper Trade First:
Before committing real capital, test your strategy using paper trading or a demo account. This helps ensure that your setups match your risk tolerance and trading style.
6. FAQs and Troubleshooting
Q: Why aren’t my VWAP lines showing properly?
A: Double-check your indicator’s settings and ensure that the selected timeframes are correctly configured in your chart’s interval.
Q: Can I change the VWAP calculation period?
A: Yes, some versions of the indicator offer adjustable parameters for the calculation period. Refer to the settings panel for customization options.
Q: What if I receive conflicting signals from different timeframes?
A: Focus on the main weekly trend for confirmation. Use shorter timeframe signals as entries once the overall trend aligns.
7. Disclaimer & Risk Management
Trading involves risk and is not suitable for every investor. This indicator is a tool to aid in your technical analysis and should be used in conjunction with sound risk management practices. Past performance is not indicative of future results. Always conduct your own research before making any trading decisions. We recommend testing the indicator in simulation mode prior to live trading.
8. Support & Further Assistance
For additional help with installation, troubleshooting, or strategy optimization, please contact our support team at Plazo Sullivan Roche Capital. We're committed to ensuring you get the most out of your Multi-Timeframe VWAP Indicator.
Script protetto
Questo script è pubblicato come codice protetto. Tuttavia, è possibile utilizzarle liberamente e senza alcuna limitazione – ulteriori informazioni qui.
AI will not replace humans. AI-Powered humans will replace everyone.
Declinazione di responsabilità
Le informazioni e le pubblicazioni non sono intese come, e non costituiscono, consulenza o raccomandazioni finanziarie, di investimento, di trading o di altro tipo fornite o approvate da TradingView. Per ulteriori informazioni, consultare i Termini di utilizzo.