OPEN-SOURCE SCRIPT
Murrey Math

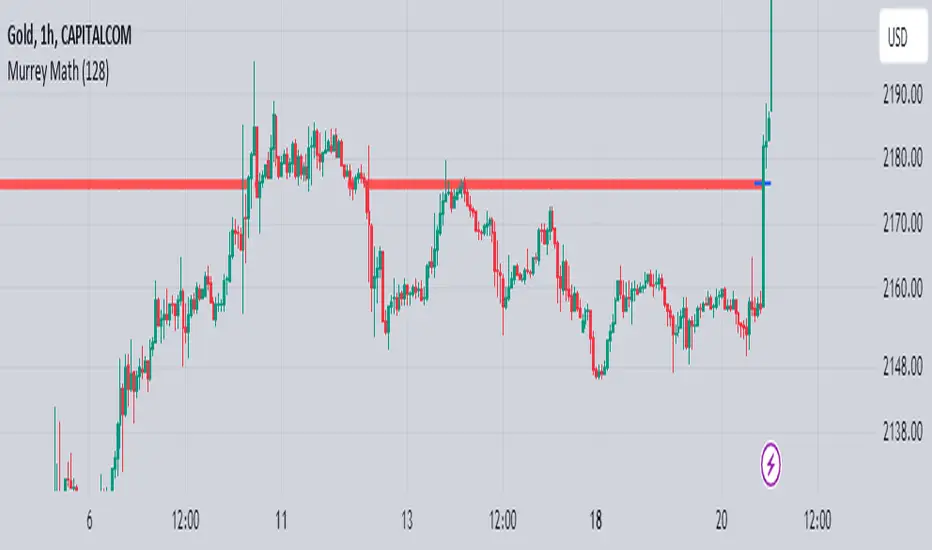
The Murrey Math indicator is a set of horizontal price levels, calculated from an algorithm developed by stock trader T.J. Murray.
The main concept behind Murrey Math is that prices tend to react and rotate at specific price levels. These levels are calculated by dividing the price range into fixed segments called "ranges", usually using a number of 8, 16, 32, 64, 128 or 256.
Murrey Math levels are calculated as follows:
1. A particular price range is taken, for example, 128.
2. Divide the current price by the range (128 in this example).
3. The result is rounded to the nearest whole number.
4. Multiply that whole number by the original range (128).
This results in the Murrey Math level closest to the current price. More Murrey levels are calculated and drawn by adding and subtracting multiples of the range to the initially calculated level.
Traders use Murrey Math levels as areas of possible support and resistance as it is believed that prices tend to react and pivot at these levels. They are also used to identify price patterns and possible entry and exit points in trading.
The Murrey Math indicator itself simply calculates and draws these horizontal levels on the price chart, allowing traders to easily visualize them and use them in their technical analysis.
HOW TO USE THIS INDICATOR?
To use the Murrey Math indicator effectively, here are some tips:
1. Choose the appropriate Murrey Math range: The Murrey Math range input (128 by default in the provided code) determines the spacing between the levels. Common ranges used are 8, 16, 32, 64, 128, and 256. A smaller range will give you more levels, while a larger range will give you fewer levels. Choose a range that suits the volatility and trading timeframe you're working with.
2. Identify potential support and resistance levels: The horizontal lines drawn by the indicator represent potential support and resistance levels based on the Murrey Math calculation. Prices often react or reverse at these levels, so they can be used to spot areas of interest for entries and exits.
3. Look for price reactions at the levels: Watch for price action like rejections, bounces, or breakouts at the Murrey Math levels. These reactions can signal potential trend continuation or reversal setups.
4. Trail stop-loss orders: You can place stop-loss orders just below/above the nearest Murrey Math level to manage risk if the price moves against your trade.
5. Set targets at future levels: Project potential profit targets by looking at upcoming Murrey Math levels in the direction of the trend.
7. Adjust range as needed: If prices are consistently breaking through levels without reacting, try adjusting the range input to a different value to see if it provides better levels.
In which asset can this indicator perform better?
The Murrey Math indicator can potentially perform well on any liquid financial asset that exhibits some degree of mean-reversion or trading range behavior. However, it may be more suitable for certain asset classes or trading timeframes than others.
Here are some assets and scenarios where the Murrey Math indicator can potentially perform better:
1. Forex Markets: The foreign exchange market is known for its ranging and mean-reverting nature, especially on higher timeframes like the daily or weekly charts. The Murrey Math levels can help identify potential support and resistance levels within these trading ranges.
2. Futures Markets: Futures contracts, such as those for commodities (e.g., crude oil, gold, etc.) or equity indices, often exhibit trading ranges and mean-reversion trends. The Murrey Math indicator can be useful in identifying potential turning points within these ranges.
3. Stocks with Range-bound Behavior: Some stocks, particularly those of large-cap companies, can trade within well-defined ranges for extended periods. The Murrey Math levels can help identify the boundaries of these ranges and potential reversal points.
4. Intraday Trading: The Murrey Math indicator may be more effective on lower timeframes (e.g., 1-hour, 30-minute, 15-minute) for intraday trading, as prices tend to respect support and resistance levels more closely within shorter time periods.
5. Trending Markets: While the Murrey Math indicator is primarily designed for range-bound markets, it can also be used in trending markets to identify potential pullback or continuation levels.
Script open-source
Nello spirito di TradingView, l'autore di questo script lo ha reso open source, in modo che i trader possano esaminarne e verificarne la funzionalità. Complimenti all'autore! Sebbene sia possibile utilizzarlo gratuitamente, ricordiamo che la ripubblicazione del codice è soggetta al nostro Regolamento.
Declinazione di responsabilità
Le informazioni e le pubblicazioni non sono intese come, e non costituiscono, consulenza o raccomandazioni finanziarie, di investimento, di trading o di altro tipo fornite o approvate da TradingView. Per ulteriori informazioni, consultare i Termini di utilizzo.