PROTECTED SOURCE SCRIPT
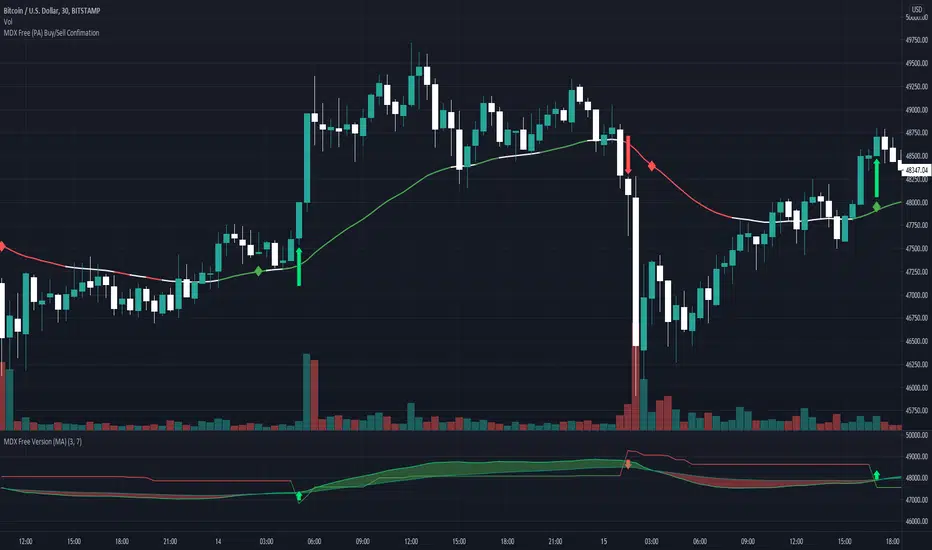
MDX Free (PA) Buy/Sell Confimation
This is a free version of the MDX Crypto trading "bot". Note that this indicator and the MDX version are based on simple code available on trading view or via google search.
This indicator is based on the super trend indicator to provide buy/sell signals at inflection points of uptrends and downtrends. These inflection points are commonly used as entry/exit points for trading. They are represented on the chart as green (buy) or red (sell) arrow.
This also uses two exponential moving averages. One average is set over 21 bars (fast) and the other is set over 55 bars (slow). When the plots intersect it represents a change in momentum. This is shown on the chart as a red (negative change) or green (positive change) diamonds. When a green diamond follows a green arrow it is considered a confirmed buy. When a red diamond follows a red arrow it is a confirmed sell.
Caution:
Caution this indicator is not reliable on its own, especially on low time scales. When looking back in time this indicator will almost always show a "confirmed buy" before a large increase in price, but on many occasions you can have a "confirmed buy" which is followed by a dump in price, that will not trigger sell signal in time. For best results use with 15m to 1h timeframes
Disclaimer:
This indicator is for informational purposes and should be used for educational purposes only. If you rely on this for trading without additional information you will loose money. I am not a financial advisor, or a professional trader. Use at your own risk.
This is an unpolished version. It may be updated and the source code published if it is used.
Script protetto
Questo script è pubblicato come codice protetto. Tuttavia, è possibile utilizzarle liberamente e senza alcuna limitazione – ulteriori informazioni qui.
Declinazione di responsabilità
Le informazioni e le pubblicazioni non sono intese come, e non costituiscono, consulenza o raccomandazioni finanziarie, di investimento, di trading o di altro tipo fornite o approvate da TradingView. Per ulteriori informazioni, consultare i Termini di utilizzo.