OPEN-SOURCE SCRIPT
Bollinger Bands %B Compare Vix

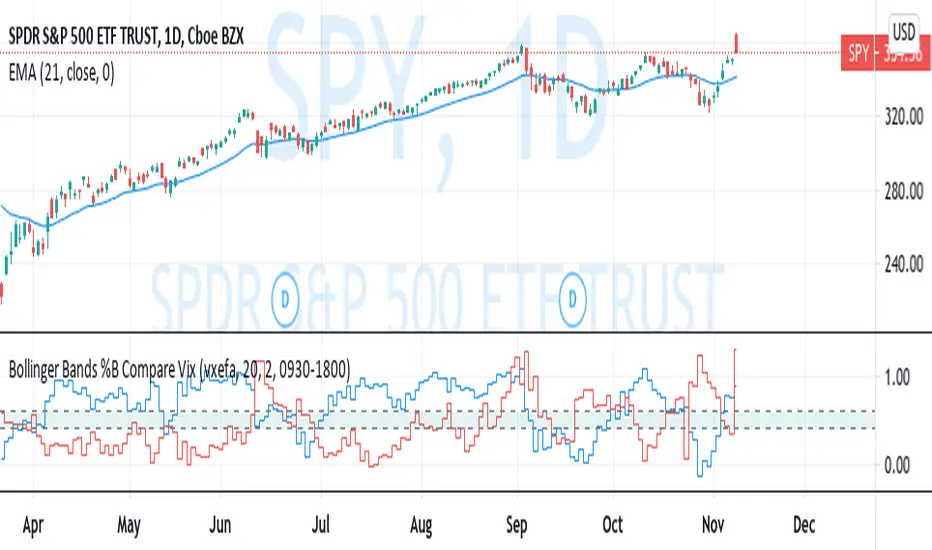
This imple script converts your chosen chart price and outputs it as a percentage in relation to the Vix percentage.
If price (Blue line) is higher than 0.60 and vix (Red Line) is lower than 0. 40 then there is lower volatility and this is good for buying.
If price (Blue line) is lower than 0. 40 and vix (Red Line) is higher than 0.60 then there is higher volatility and this is good for selling, exiting and cash only.
If you like risk you can enter as soon as the price and vix cross in either direction
This is my first script, please give me a lot of critique, I won't cry hahaha :)
For greater accuracy, you use these Vix products for their specific stocks/Indicies:
Apple - VVXAPL
Google - VVXGOG
Amazon - VVXAZN
IBM - VVXIBM
Goldman Sachs - VVXGS
NASDAQ 100 = VXN
VXN
SP100 - $CBOE:VXO
SP500 (3months) - VIX3M
VIX3M
XLE(energy sector) - $CBOE:VXXLE
EWZ(brazil etf) - VVXEWZ
EEM( emerging markets etf) -VVXEEM
EFA (MSCI ETF) - VVXEFA
FXI (Cina ETF) - VVXFXI
If price (Blue line) is higher than 0.60 and vix (Red Line) is lower than 0. 40 then there is lower volatility and this is good for buying.
If price (Blue line) is lower than 0. 40 and vix (Red Line) is higher than 0.60 then there is higher volatility and this is good for selling, exiting and cash only.
If you like risk you can enter as soon as the price and vix cross in either direction
This is my first script, please give me a lot of critique, I won't cry hahaha :)
For greater accuracy, you use these Vix products for their specific stocks/Indicies:
Apple - VVXAPL
Google - VVXGOG
Amazon - VVXAZN
IBM - VVXIBM
Goldman Sachs - VVXGS
NASDAQ 100 =
SP100 - $CBOE:VXO
SP500 (3months) -
XLE(energy sector) - $CBOE:VXXLE
EWZ(brazil etf) - VVXEWZ
EEM( emerging markets etf) -VVXEEM
EFA (MSCI ETF) - VVXEFA
FXI (Cina ETF) - VVXFXI
Script open-source
Nello spirito di TradingView, l'autore di questo script lo ha reso open source, in modo che i trader possano esaminarne e verificarne la funzionalità. Complimenti all'autore! Sebbene sia possibile utilizzarlo gratuitamente, ricordiamo che la ripubblicazione del codice è soggetta al nostro Regolamento.
Declinazione di responsabilità
Le informazioni e le pubblicazioni non sono intese come, e non costituiscono, consulenza o raccomandazioni finanziarie, di investimento, di trading o di altro tipo fornite o approvate da TradingView. Per ulteriori informazioni, consultare i Termini di utilizzo.