OPEN-SOURCE SCRIPT
Aggiornato Volatility & Big Market Moves

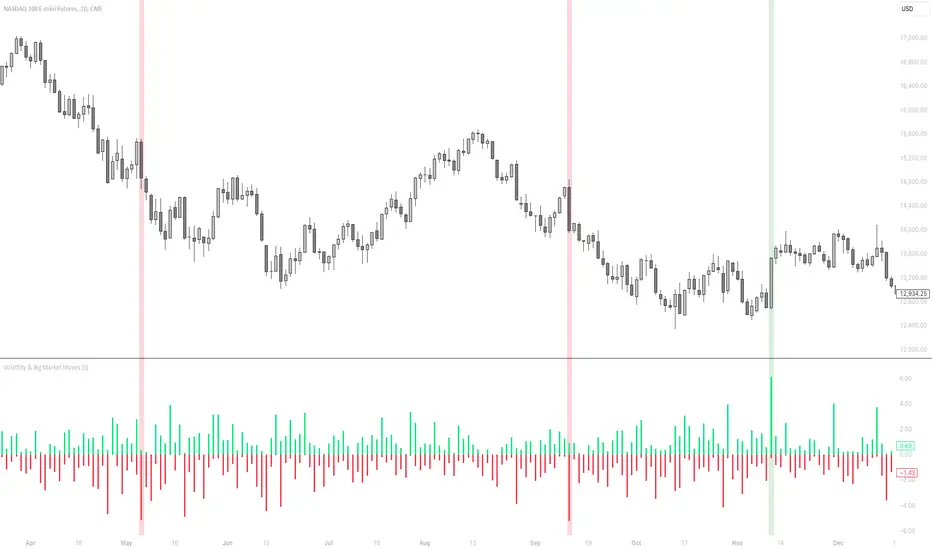
This indicator shows the volatility per candle, and highlights candles where volatility exceeds a defined threshold.
Data shown:
Furthest %-distance from the previous candle's closing price to the top (positive histogram).
Furthest %-distance from the previous candle's closing price to the bottom (negative histogram).
Data shown:
Furthest %-distance from the previous candle's closing price to the top (positive histogram).
Furthest %-distance from the previous candle's closing price to the bottom (negative histogram).
Note di rilascio
Slightly adjusted the calculation to calculate from the previous candle close instead of the current candle's high/low.Note di rilascio
"na" values in the histogram are now replaced with 0, so that the label on the scale shows the current candle's value at any time.Script open-source
Nello spirito di TradingView, l'autore di questo script lo ha reso open source, in modo che i trader possano esaminarne e verificarne la funzionalità. Complimenti all'autore! Sebbene sia possibile utilizzarlo gratuitamente, ricordiamo che la ripubblicazione del codice è soggetta al nostro Regolamento.
Declinazione di responsabilità
Le informazioni e le pubblicazioni non sono intese come, e non costituiscono, consulenza o raccomandazioni finanziarie, di investimento, di trading o di altro tipo fornite o approvate da TradingView. Per ulteriori informazioni, consultare i Termini di utilizzo.
Script open-source
Nello spirito di TradingView, l'autore di questo script lo ha reso open source, in modo che i trader possano esaminarne e verificarne la funzionalità. Complimenti all'autore! Sebbene sia possibile utilizzarlo gratuitamente, ricordiamo che la ripubblicazione del codice è soggetta al nostro Regolamento.
Declinazione di responsabilità
Le informazioni e le pubblicazioni non sono intese come, e non costituiscono, consulenza o raccomandazioni finanziarie, di investimento, di trading o di altro tipo fornite o approvate da TradingView. Per ulteriori informazioni, consultare i Termini di utilizzo.