OPEN-SOURCE SCRIPT
[LAVA] UNO Overlay
EDIT: Ignore the comments... I can't get the update to show due to hard brackets "[ ]" being censored for some reason.... but they show up in here so this is where the updates will show.
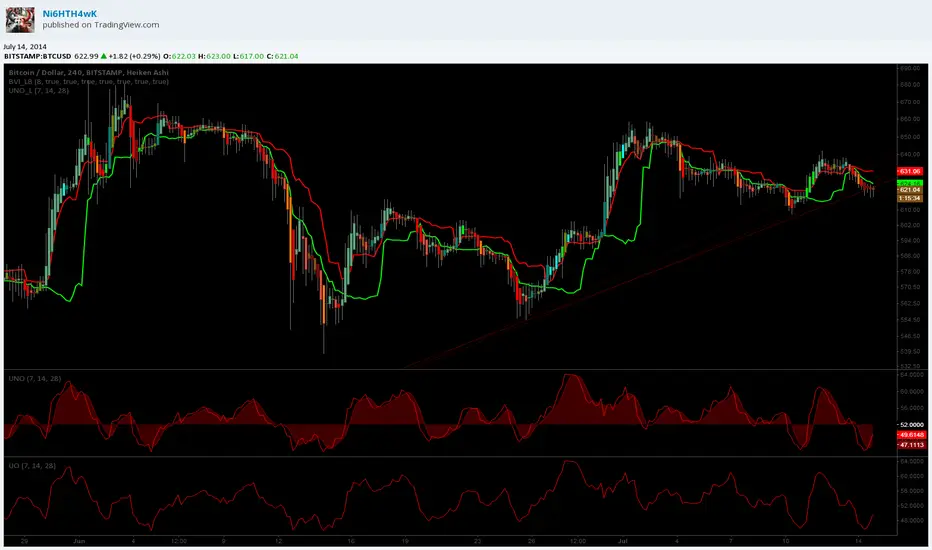
This is the Ultimate (Nonlinear) Oscillator in overlay format. Took me a while to figure out the best configuration and finally found this one. From what I've observed, this is basically a support/resistance line indicator. When the candle moves thru the supporting/resisting line, its a entry/exit point or an indicator that the opposite side should be targeted depending on the market condition. Ignore the wicks as they go thru the line constantly.
Go here to see updates...
pastebin.com/vziz8rzd
Script open-source
In pieno spirito TradingView, il creatore di questo script lo ha reso open-source, in modo che i trader possano esaminarlo e verificarne la funzionalità. Complimenti all'autore! Sebbene sia possibile utilizzarlo gratuitamente, ricorda che la ripubblicazione del codice è soggetta al nostro Regolamento.
Declinazione di responsabilità
Le informazioni ed i contenuti pubblicati non costituiscono in alcun modo una sollecitazione ad investire o ad operare nei mercati finanziari. Non sono inoltre fornite o supportate da TradingView. Maggiori dettagli nelle Condizioni d'uso.