OPEN-SOURCE SCRIPT
Buy/Sell Volume Totals for Period

This indicator can be used to help you tell the difference between Wyckoff Accumulation and Distribution.
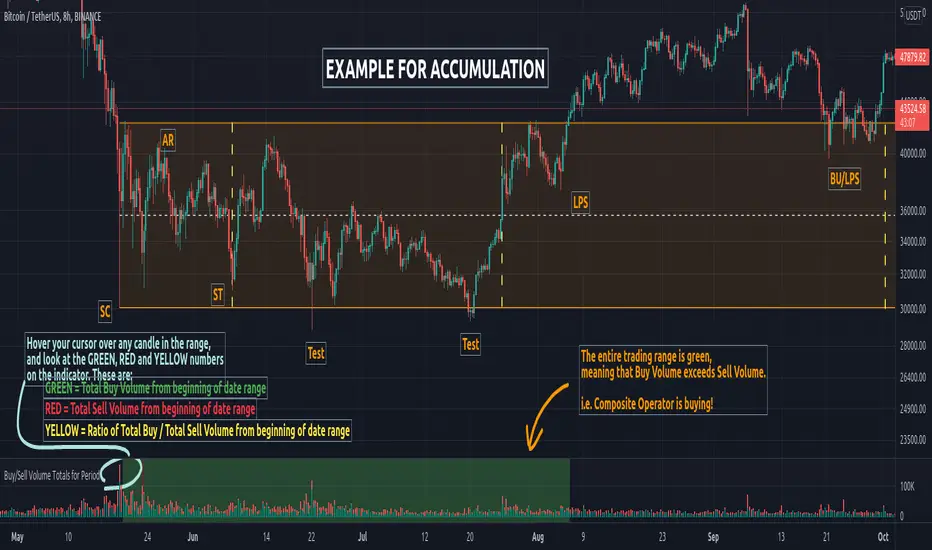
The idea is to add up all the Buy Volume and all the Sell Volume separately from the beginning of the Trading Range (TR) for each candle. You can define the Start and End dates in the settings of the indicator.
The indicator will show you 3 numbers of interest:
When the Total Buy Volume exceeds the Total Sell Volume in the TR, the indicator will color the background in GREEN color, to indicate possible accumulation. Otherwise the background will be RED, to indicate possible distribution.
You can float your cursor over any candle to see the current Volume Totals at that candle from the beginning of the TR (set by you in settings to a specific date).
Here's a few examples of the indicator in action:
1) Accumulation

2) Distribution

3) Possible Re-distribution

Please note that this indicator is meant to be used in combination with other analysis techniques from the Wyckoff Methodology!
The idea is to add up all the Buy Volume and all the Sell Volume separately from the beginning of the Trading Range (TR) for each candle. You can define the Start and End dates in the settings of the indicator.
The indicator will show you 3 numbers of interest:
- GREEN = Total Buy Volume from beginning of date range
- RED = Total Sell Volume from beginning of date range
- YELLOW = Ratio of Total Buy / Total Sell Volume from beginning of date range
When the Total Buy Volume exceeds the Total Sell Volume in the TR, the indicator will color the background in GREEN color, to indicate possible accumulation. Otherwise the background will be RED, to indicate possible distribution.
You can float your cursor over any candle to see the current Volume Totals at that candle from the beginning of the TR (set by you in settings to a specific date).
Here's a few examples of the indicator in action:
1) Accumulation
2) Distribution
3) Possible Re-distribution
Please note that this indicator is meant to be used in combination with other analysis techniques from the Wyckoff Methodology!
Script open-source
Nello spirito di TradingView, l'autore di questo script lo ha reso open source, in modo che i trader possano esaminarne e verificarne la funzionalità. Complimenti all'autore! Sebbene sia possibile utilizzarlo gratuitamente, ricordiamo che la ripubblicazione del codice è soggetta al nostro Regolamento.
Declinazione di responsabilità
Le informazioni e le pubblicazioni non sono intese come, e non costituiscono, consulenza o raccomandazioni finanziarie, di investimento, di trading o di altro tipo fornite o approvate da TradingView. Per ulteriori informazioni, consultare i Termini di utilizzo.