PINE LIBRARY
Aggiornato pta_plot
Library "pta_plot"
pta_plot: This library will help you to plot different value. I will keep updating with your requirement
print_array(array_id, border_color)
Display array element as a table.
Parameters:
array_id: Id of your array.
border_color: Color for border (`color.black` is used if no argument is supplied).
Returns: Display array element in bottom of the pane.
Note di rilascio
v2Added:
print_array_float(array_id, border_color)
Display array element as a table.
Parameters:
array_id: Id of your array.
border_color: Color for border (`color.black` is used if no argument is supplied).
Returns: Display array element in bottom of the pane.
print_array_int(array_id, border_color)
Display array element as a table.
Parameters:
array_id: Id of your array.
border_color: Color for border (`color.black` is used if no argument is supplied).
Returns: Display array element in bottom of the pane.
Removed:
print_array(array_id, border_color)
Display array element as a table.
Note di rilascio
v3Added:
print_array_string(array_id, border_color)
Display array element as a table.
Parameters:
array_id: Id of your array.
border_color: Color for border (`color.black` is used if no argument is supplied).
Returns: Display array element in bottom of the pane.
Note di rilascio
v4Note di rilascio
v5Added:
print_array_bool(array_id, border_color)
Display array element as a table.
Parameters:
array_id: Id of your array.
border_color: Color for border (`color.black` is used if no argument is supplied).
Returns: Display array element in bottom of the pane.
Note di rilascio
v6Added:
peakprofit(longcondition, shortcondition)
peakprofit: This function will create a label for max profit in trade range.
Parameters:
longcondition: is a Boolean Value
shortcondition: is a Boolean Value
Returns: peakprofit Create Label on Chart
Instruction: Don't forget to add max_labels_count=500, max_bars_back=500
Note di rilascio
v7Updated:
print_array_float(array_id, position, border_color)
Display array element as a table.
Parameters:
array_id: Id of your array.
position
border_color: Color for border (`color.black` is used if no argument is supplied).
Returns: Display array element in bottom of the pane.
print_array_int(array_id, position, border_color)
Display array element as a table.
Parameters:
array_id: Id of your array.
position: Position of Table
border_color: Color for border (`color.black` is used if no argument is supplied).
Returns: Display array element in bottom of the pane.
print_array_string(array_id, position, border_color)
Display array element as a table.
Parameters:
array_id: Id of your array.
position: Position of Table
border_color: Color for border (`color.black` is used if no argument is supplied).
Returns: Display array element in bottom of the pane.
print_array_bool(array_id, position, border_color)
Display array element as a table.
Parameters:
array_id: Id of your array.
position: Position of Table
border_color: Color for border (`color.black` is used if no argument is supplied).
Returns: Display array element in bottom of the pane.
Removed:
peakprofit(longcondition, shortcondition)
peakprofit: This function will create a label for max profit in trade range.
Note di rilascio
v8Added:
calcCPR(High, Low, Close)
Return CPR.
Parameters:
High (float)
Low (float)
Close (float)
Returns: CPR Value as Tuple [pp, tc, bc, r1, r2, r3, r4, s1, s2, s3, s4].
Note di rilascio
Version 9 Updates:- `dll` function:
- Function's purpose : Plot a horizontal line and label at a specified price level on the chart.
- Parameters:
- Price (float): The Y value for the line and label.
- Text (string): The text to display alongside the label.
- Color (color): The color for the line and label text.
- Width (int, default=1): The width of the line.
- LineStyle (string, default=line.style_solid): The style of the line.
- Historical (bool, default=false): If true, the line and label will appear on historical chart data.
- Returns: Displays a horizontal line and label on the chart.
- Motive: Enhances readability and usability by providing a function for plotting customizable lines and labels on charts.
Note di rilascio
v10- `dll` function updated:
- Function's purpose : Plot a horizontal line and label at a specified price level on the chart.
- Parameters:
- Price (float): The Y value for the line and label.
- Text (string): The text to display alongside the label.
- Color (color): The color for the line and label text.
- Width (int, default=1): The width of the line.
- LineStyle (string, default=line.style_solid): The style of the line.
- Historical (bool, default=false): If true, the line and label will appear on historical chart data.
- Returns: Displays a horizontal line and label on the chart.
- Motive: Enhances readability and usability by providing a function for plotting customizable lines and labels on charts.
Note di rilascio
v11Updated:
dll(Price, Text, barCount, Color, Width, LineStyle, Historical)
Parameters:
Price (float)
Text (string)
barCount (int)
Color (color)
Width (int)
LineStyle (string)
Historical (bool)
Note di rilascio
v12Added:
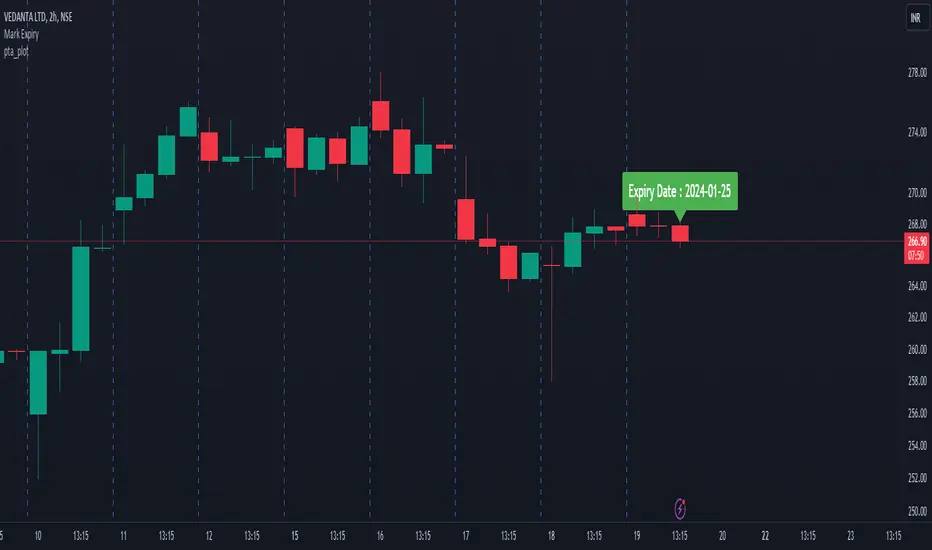
getExpiry(expiryType, expiryDay, changeExpiry, format)
Parameters:
expiryType (string)
expiryDay (string)
changeExpiry (int)
format (string)
Libreria Pine
Nello spirito di TradingView, l'autore ha pubblicato questo codice Pine come libreria open source affinché altri programmatori della nostra comunità possano riutilizzarlo. Complimenti all'autore! È possibile utilizzare questa libreria privatamente o in altre pubblicazioni open source, ma il riutilizzo di questo codice nelle pubblicazioni è soggetto al Regolamento.
Declinazione di responsabilità
Le informazioni e le pubblicazioni non sono intese come, e non costituiscono, consulenza o raccomandazioni finanziarie, di investimento, di trading o di altro tipo fornite o approvate da TradingView. Per ulteriori informazioni, consultare i Termini di utilizzo.