OPEN-SOURCE SCRIPT
Earnings Levels
I am proud to announce that the formerly secret "Key Earnings Levels" graphing tool will be freely available to TradingView users whereas before it was only available by monthly or annual subscription since its invention here at TradingView many years ago by Tim West. TradingView code writers wrote the original code for using this powerful tool and then Johannes Falkenburg re-wrote the code several years ago.
The most important FOUR days a year in a stock chart are the days that the company gives its quarterly update. Since the GRAND majority of companies have earnings, the indicator is called the "Key Earnings Level", or KEL for short. The unique part of the release of the quarterly update is that it can be "before the open" or "after the close" and the price action leading up to the earnings and immediately after the earnings are useful for future reference, as you'll see shortly.
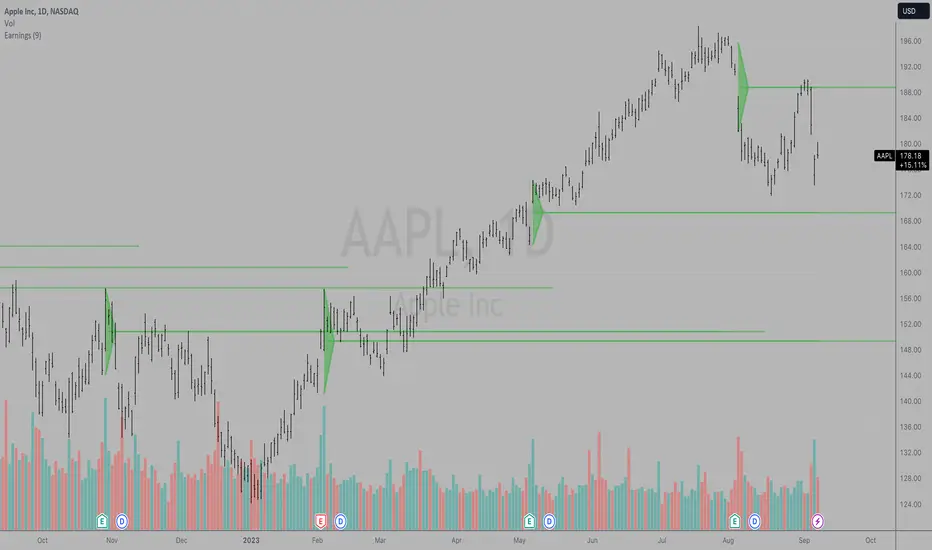
The Key Earnings indicator plots a triangle for the range around the day before and the day after earnings and draws a mid-point line to capture the over/under level for that report. That mid-point line is then extended into the future for a minimum of one quarter until the next earnings report and as long as a year with the current code.
This triangle plot allows you to see how a stock is trading RELATIVE TO where it was trading when earnings were announced and when a glimpse into the current quarter along with projections for the upcoming year.
Simply put: Key Earnings Levels are the easiest way to see how a stock is doing relative to the most important four days a year.
You can devise your own trading strategies around these levels, but I want you to have this information so you can see it and know it too. I've kept this little secret of Key Hidden Levels to myself and my followers in the Key Hidden Levels Chat Room here at TradingView for far too long. I have occasionally published charts with the Key Earnings Levels but have not made the code freely available to TradingView subscribers.
If anyone has paid me for access to these indicators and wants a refund, I will be glad to do that. This is too important to keep from everyone any longer. I think it is essential to make this available to everyone to make sure we all have the most advantage we can get when investing and trading in the markets.
I hope you can all find the powerful benefit from using Key Earnings Levels and please thank Johannes Falkenburg aka Vollchaot here at TradingView for writing the latest version of this code.
The idea itself came from using TradingView and the powerful graphing and layout features here to track our observations and to do research. Thank you TradingView for such a great product.
I look forward to answering any questions.
Sincerely,
Tim West
The most important FOUR days a year in a stock chart are the days that the company gives its quarterly update. Since the GRAND majority of companies have earnings, the indicator is called the "Key Earnings Level", or KEL for short. The unique part of the release of the quarterly update is that it can be "before the open" or "after the close" and the price action leading up to the earnings and immediately after the earnings are useful for future reference, as you'll see shortly.
The Key Earnings indicator plots a triangle for the range around the day before and the day after earnings and draws a mid-point line to capture the over/under level for that report. That mid-point line is then extended into the future for a minimum of one quarter until the next earnings report and as long as a year with the current code.
This triangle plot allows you to see how a stock is trading RELATIVE TO where it was trading when earnings were announced and when a glimpse into the current quarter along with projections for the upcoming year.
Simply put: Key Earnings Levels are the easiest way to see how a stock is doing relative to the most important four days a year.
You can devise your own trading strategies around these levels, but I want you to have this information so you can see it and know it too. I've kept this little secret of Key Hidden Levels to myself and my followers in the Key Hidden Levels Chat Room here at TradingView for far too long. I have occasionally published charts with the Key Earnings Levels but have not made the code freely available to TradingView subscribers.
If anyone has paid me for access to these indicators and wants a refund, I will be glad to do that. This is too important to keep from everyone any longer. I think it is essential to make this available to everyone to make sure we all have the most advantage we can get when investing and trading in the markets.
I hope you can all find the powerful benefit from using Key Earnings Levels and please thank Johannes Falkenburg aka Vollchaot here at TradingView for writing the latest version of this code.
The idea itself came from using TradingView and the powerful graphing and layout features here to track our observations and to do research. Thank you TradingView for such a great product.
I look forward to answering any questions.
Sincerely,
Tim West
Script open-source
Nello spirito di TradingView, l'autore di questo script lo ha reso open source, in modo che i trader possano esaminarne e verificarne la funzionalità. Complimenti all'autore! Sebbene sia possibile utilizzarlo gratuitamente, ricordiamo che la ripubblicazione del codice è soggetta al nostro Regolamento.
Subscribe to my indicator package KEY HIDDEN LEVELS $10/mo or $100/year and join me in the trading room KEY HIDDEN LEVELS here at TradingView.com
Declinazione di responsabilità
Le informazioni e le pubblicazioni non sono intese come, e non costituiscono, consulenza o raccomandazioni finanziarie, di investimento, di trading o di altro tipo fornite o approvate da TradingView. Per ulteriori informazioni, consultare i Termini di utilizzo.
Script open-source
Nello spirito di TradingView, l'autore di questo script lo ha reso open source, in modo che i trader possano esaminarne e verificarne la funzionalità. Complimenti all'autore! Sebbene sia possibile utilizzarlo gratuitamente, ricordiamo che la ripubblicazione del codice è soggetta al nostro Regolamento.
Declinazione di responsabilità
Le informazioni e le pubblicazioni non sono intese come, e non costituiscono, consulenza o raccomandazioni finanziarie, di investimento, di trading o di altro tipo fornite o approvate da TradingView. Per ulteriori informazioni, consultare i Termini di utilizzo.