OPEN-SOURCE SCRIPT
Support and Resistance
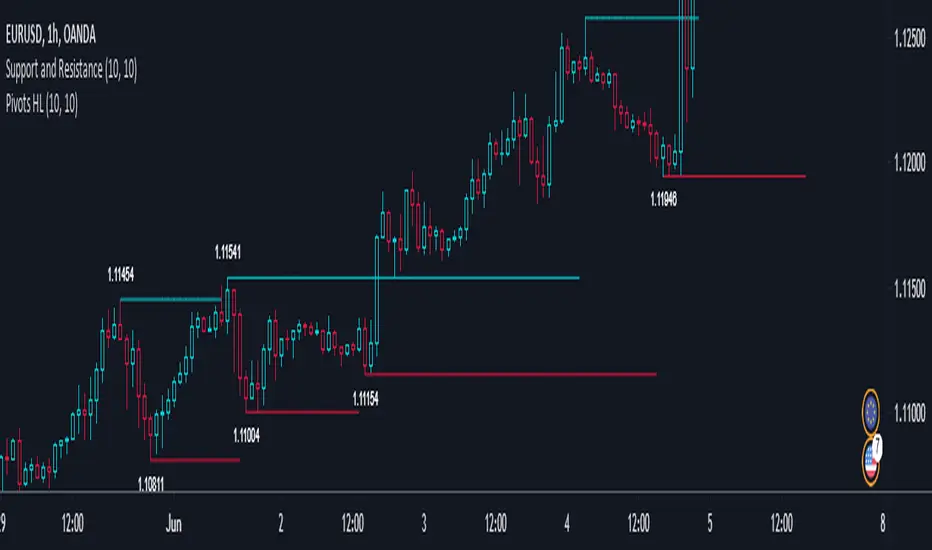
1. This indicator draw line at the pivot point to show possible support and resistance area.
2. The way it is drawn is pretty simple. Every time a pivot point is formed, a line is drawn on top of it.
3. The line will be delayed due to the nature of pivot point itself.
2. The way it is drawn is pretty simple. Every time a pivot point is formed, a line is drawn on top of it.
3. The line will be delayed due to the nature of pivot point itself.
Script open-source
Nello spirito di TradingView, l'autore di questo script lo ha reso open source, in modo che i trader possano esaminarne e verificarne la funzionalità. Complimenti all'autore! Sebbene sia possibile utilizzarlo gratuitamente, ricordiamo che la ripubblicazione del codice è soggetta al nostro Regolamento.
Declinazione di responsabilità
Le informazioni e le pubblicazioni non sono intese come, e non costituiscono, consulenza o raccomandazioni finanziarie, di investimento, di trading o di altro tipo fornite o approvate da TradingView. Per ulteriori informazioni, consultare i Termini di utilizzo.