OPEN-SOURCE SCRIPT
Aggiornato US Liquidity-Weighted Business Cycle
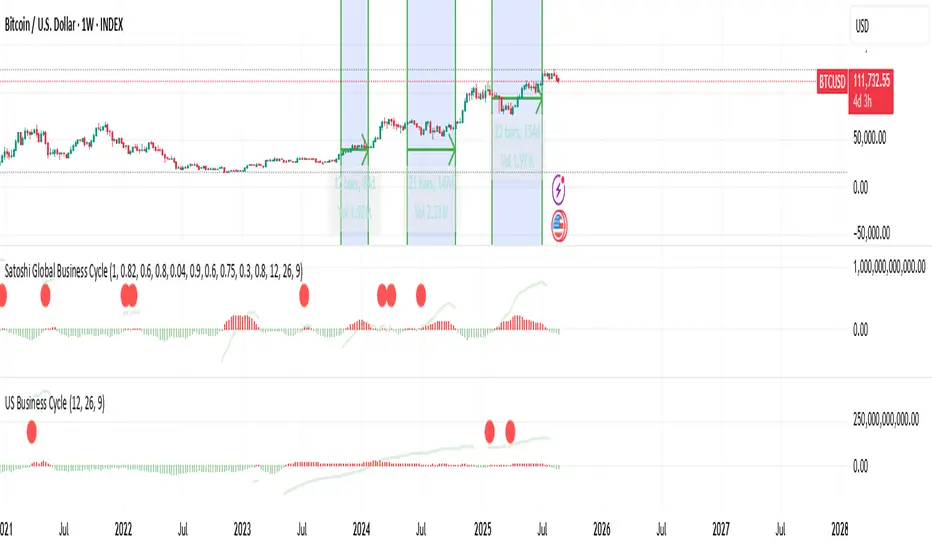
📈 BTC Liquidity-Weighted Business Cycle
This indicator models the Bitcoin macro cycle by comparing its logarithmic price against a log-transformed liquidity proxy (e.g., US M2 Money Supply). It helps visualize cyclical tops and bottoms by measuring the relative expansion of Bitcoin price versus fiat liquidity.
🧠 How It Works:
Transforms both BTC and M2 using natural logarithms.
Computes a liquidity ratio: log(BTC) – log(M2) (i.e., log(BTC/M2)).
Runs MACD on this ratio to extract business cycle momentum.
Plots:
🔴 Histogram bars showing cyclical growth or contraction.
🟢 Top line to track the relative price-to-liquidity trend.
🔴 Cycle peak markers to flag historical market tops.
⚙️ Inputs:
Adjustable MACD lengths
Toggle for liquidity trend line overlay
🔍 Use Cases:
Identifying macro cycle tops and bottoms
Timing long-term Bitcoin accumulation or de-risking
Confirming global liquidity's influence on BTC price movement
Note: This version currently uses US M2 (FRED:M2SL) as the liquidity base. You can easily expand it with other global M2 sources or adjust the weights.
Note di rilascio
BTC Liquidity-Weighted Business CycleThis indicator models Bitcoin’s macro cycle by comparing its logarithmic price to a log-transformed liquidity proxy, such as US M2 Money Supply (FRED:M2SL). The aim is to highlight cyclical expansions and contractions by tracking how Bitcoin’s price evolves relative to fiat liquidity growth.
Technical Explanation
Log Transformation: Both BTC price and M2 liquidity are expressed in natural logarithms to capture proportional changes rather than raw levels.
Liquidity Ratio: The indicator evaluates Bitcoin’s performance relative to liquidity growth by comparing log(BTC) against log(M2).
MACD Framework: A Moving Average Convergence Divergence model is applied to the ratio to extract cycle momentum, with adjustable lengths.
Visual Outputs:
Histogram bars show expansion (positive momentum) or contraction (negative momentum).
An optional overlay line tracks the long-term BTC-to-liquidity trend.
Peak markers flag potential cycle tops.
User-Friendly Overview
Think of this as a Bitcoin business cycle tracker.
When the histogram is positive, BTC is expanding faster than liquidity (risk-on conditions).
When it’s negative, BTC is underperforming liquidity (risk-off conditions).
Cycle markers give an idea of when long-term tops and bottoms may form.
Use Cases
Spotting macro cycle tops and bottoms in Bitcoin
Timing accumulation or profit-taking windows
Understanding how monetary expansion or contraction affects BTC price action
Notes
The default version uses US M2 (FRED:M2SL) as the liquidity base. Traders may extend the framework to include additional global M2 sources or custom liquidity indices with user-defined weights.
Script open-source
Nello spirito di TradingView, l'autore di questo script lo ha reso open source, in modo che i trader possano esaminarne e verificarne la funzionalità. Complimenti all'autore! Sebbene sia possibile utilizzarlo gratuitamente, ricordiamo che la ripubblicazione del codice è soggetta al nostro Regolamento.
Declinazione di responsabilità
Le informazioni e le pubblicazioni non sono intese come, e non costituiscono, consulenza o raccomandazioni finanziarie, di investimento, di trading o di altro tipo fornite o approvate da TradingView. Per ulteriori informazioni, consultare i Termini di utilizzo.