OPEN-SOURCE SCRIPT
Aggiornato ATR Table 2.0
ATR Table 2.0
This script was created in order to display a table that "calculates" how far the price can go on the current day.
The script is a table with 3 lines that calculates:
Example of how to use the information on the table and the understanding of it's purpose:
1) Supose you are day trading an asset that, during the last 10 days, have moved around $1.00 a day - This is the 10 Day ATR.
2) On this day, after 2 hours of the opening market, the price have already moved $0.50 (supose that it has moved $0.30 up and $0.35 down from the close of the prior day and the price is now near the close of the prior day).
3) In this situation, knowing that the price often moves around $1.00 a day, and knowing that it already moved $0.65 ($0.30 up and $0.35 down based on the close of the prior day), you may pay attention when the price breaksthrough the max or the min of the day, cause it can still move $0.35 in that direction ($1.00 - $0.65).
----------------------------------------------
ATR Table 2.0
Esse script foi criado para disponibilizar uma tabela que "calcula" quanto o preço pode andar ainda no dia em questão.
O script é uma tabela com 3 linhas que calcula:
Exemplo de como usar essa informação na tabela e o entendimento do seu propósito:
1) Suponha que você está realizando day trade de um ativo que, durante os últimos 10 dias, se move em torno de $1.00 por dia. Esse é o ATR de 10 dias.
2) Nesse dia, após 2 horas da abertura do pregão, o preço já se moveu $.050 (suponhamos que ele tenha se moveu $0.30 para cima e $0.35 para baixo a partir do fechamento do dia anterior e agora o preço está próximo do fechamento do dia anterior).
3) Nessa situação, sabendo que o preço se move por volta de $1.00 por dia, e sabendo que ele já se moveu $0.65 ($0.30 pra cima e $0.35 pra baixo a partir do fechamento do dia anterior), você deve se atentar para quando o preço romper a máxima ou a mínima do dia, pois ele pode se mover ainda $.035 na direção do rompimento ($1.00 - $0.65).
This script was created in order to display a table that "calculates" how far the price can go on the current day.
The script is a table with 3 lines that calculates:
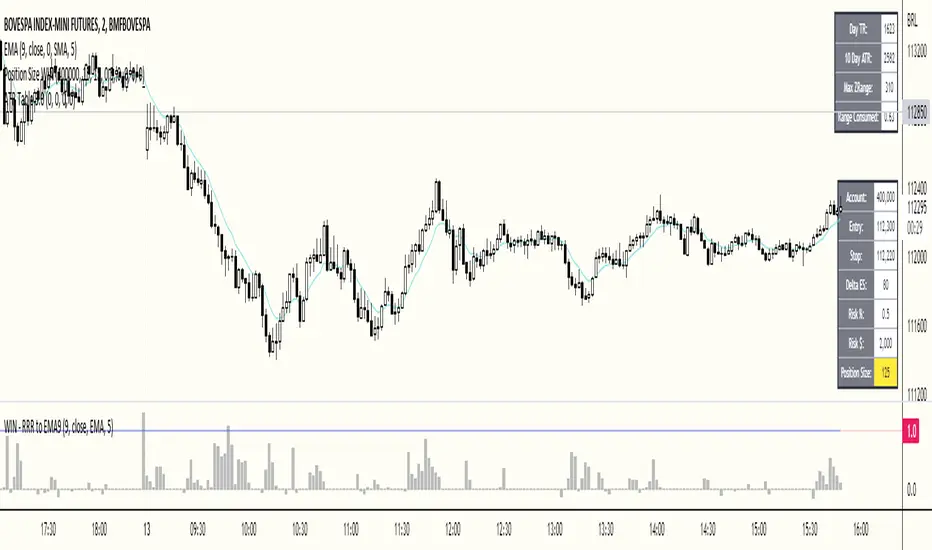
- First Line - Day TR: The True Range of the current day ([Max of the day] - [Min of the day], including an Opening GAP if it exists);
- Second Line - 10 Day ATR: The Average True Range of the asset (including Opening GAPs) for the last 10 days;
- Third LIne - Range Consumed: How much of the 10 Day ATR it was consumed on the current day.
Example of how to use the information on the table and the understanding of it's purpose:
1) Supose you are day trading an asset that, during the last 10 days, have moved around $1.00 a day - This is the 10 Day ATR.
2) On this day, after 2 hours of the opening market, the price have already moved $0.50 (supose that it has moved $0.30 up and $0.35 down from the close of the prior day and the price is now near the close of the prior day).
3) In this situation, knowing that the price often moves around $1.00 a day, and knowing that it already moved $0.65 ($0.30 up and $0.35 down based on the close of the prior day), you may pay attention when the price breaksthrough the max or the min of the day, cause it can still move $0.35 in that direction ($1.00 - $0.65).
----------------------------------------------
ATR Table 2.0
Esse script foi criado para disponibilizar uma tabela que "calcula" quanto o preço pode andar ainda no dia em questão.
O script é uma tabela com 3 linhas que calcula:
- Primeira Linha - TR do Dia: O Range Verdadeira do dia em questão ([Max do dia] - [Min do dia], incluindo GAP de Abertura se for o caso);
- Segunda Linha - ATR de 10 Dias: A média do Range Verdadeira do ativo (incluindo GAPs de abertura) dos últimos 10 dias;
- Terceira Linha - Range Consumido: O quanto do ATR de 10dias já foi consumido no dia em questão.
Exemplo de como usar essa informação na tabela e o entendimento do seu propósito:
1) Suponha que você está realizando day trade de um ativo que, durante os últimos 10 dias, se move em torno de $1.00 por dia. Esse é o ATR de 10 dias.
2) Nesse dia, após 2 horas da abertura do pregão, o preço já se moveu $.050 (suponhamos que ele tenha se moveu $0.30 para cima e $0.35 para baixo a partir do fechamento do dia anterior e agora o preço está próximo do fechamento do dia anterior).
3) Nessa situação, sabendo que o preço se move por volta de $1.00 por dia, e sabendo que ele já se moveu $0.65 ($0.30 pra cima e $0.35 pra baixo a partir do fechamento do dia anterior), você deve se atentar para quando o preço romper a máxima ou a mínima do dia, pois ele pode se mover ainda $.035 na direção do rompimento ($1.00 - $0.65).
Note di rilascio
Changes on the Table Description-----
Alterações nas descrições da tabela
Note di rilascio
Added a new row to the table, Max ZRange, displaying the maximum theoretical value for Support and Resistance Zones.This value is a result of 12% of the 10 Day ATR.
-----------------
Adicionada uma nova linha na tabela, Maz ZRange, mostrando o valor teórico máximo para Zonas de Suporte e Resistência.
Esse valor é o resultado de 12% do ATR de 10 dias.
Note di rilascio
Visual improvementsNote di rilascio
Table "Max ZRange" fixed.Script open-source
In pieno spirito TradingView, il creatore di questo script lo ha reso open-source, in modo che i trader possano esaminarlo e verificarne la funzionalità. Complimenti all'autore! Sebbene sia possibile utilizzarlo gratuitamente, ricorda che la ripubblicazione del codice è soggetta al nostro Regolamento.
Declinazione di responsabilità
Le informazioni ed i contenuti pubblicati non costituiscono in alcun modo una sollecitazione ad investire o ad operare nei mercati finanziari. Non sono inoltre fornite o supportate da TradingView. Maggiori dettagli nelle Condizioni d'uso.
Script open-source
In pieno spirito TradingView, il creatore di questo script lo ha reso open-source, in modo che i trader possano esaminarlo e verificarne la funzionalità. Complimenti all'autore! Sebbene sia possibile utilizzarlo gratuitamente, ricorda che la ripubblicazione del codice è soggetta al nostro Regolamento.
Declinazione di responsabilità
Le informazioni ed i contenuti pubblicati non costituiscono in alcun modo una sollecitazione ad investire o ad operare nei mercati finanziari. Non sono inoltre fornite o supportate da TradingView. Maggiori dettagli nelle Condizioni d'uso.