Average True Range (ATR)

Options Strategy V1.3📈 Options Strategy V1.3 — EMA Crossover + RSI + ATR + Opening Range
Overview:
This strategy is designed for short-term directional trades on large-cap stocks or ETFs, especially when trading options. It combines classic trend-following signals with momentum confirmation, volatility-based risk management, and session timing filters to help identify high-probability entries with predefined stop-loss and profit targets.
🔍 Strategy Components:
EMA Crossover (Fast/Slow)
Entry signals are triggered by the crossover of a short EMA above or below a long EMA — a traditional trend-following method to detect shifts in momentum.
RSI Filter
RSI confirms the signal by avoiding entries in overbought/oversold zones unless certain momentum conditions are met.
Long entry requires RSI ≥ Long Threshold
Short entry requires RSI ≤ Short Threshold
ATR-Based SL & TP
Stop-loss is set dynamically as a multiple of ATR below (long) or above (short) the entry price.
Take-profit is placed as a ratio (TP/SL) of the stop distance, ensuring consistent reward/risk structure.
Opening Range Filter (Optional)
If enabled, the strategy only triggers trades after price breaks out of the 09:30–09:45 EST range, ensuring participation in directional moves.
Session Filters
No trades from 04:00 to 09:30 and from 16:00 to 20:00 EST, avoiding low-liquidity periods.
All open trades are closed at 15:55 EST, to avoid overnight risk or expiration issues for options.
⚙️ Built-in Presets:
You can choose one of the built-in ticker-specific presets for optimal conditions:
Ticker EMAs RSI (Long/Short) ATR SL×ATR TP/SL
SPY 8/28 56 / 26 14 1.4× 4.0×
TSLA 23/27 56 / 33 13 1.4× 3.6×
AAPL 6/13 61 / 26 23 1.4× 2.1×
MSFT 25/32 54 / 26 14 1.2× 2.2×
META 25/32 53 / 26 17 1.8× 2.3×
AMZN 28/32 55 / 25 16 1.8× 2.3×
You can also choose "Custom" to fully configure all parameters to your own market and strategy preferences.
📌 Best Use Case:
This strategy is especially suited for intraday options trading, where timing and risk control are critical. It works best on liquid tickers with strong trends or clear breakout behavior.

Volatility Strategy 01a quantitative volatility strategy (especially effective in trend direction on the 15min chart on the s&p-index)
the strategy is a rule-based setup, which dynamically adapts to the implied volatility structure (vx1!–vx2!)
context-dependent mean reversion strategy based on multiple timeframes in the vix index
a signal is provided under following conditions:
1. the vvix/vix spread has deviated significantly beyond one standard deviation
2. the vix is positioned above or below 3 moving averages on 3 minor timeframes
3. the trade direction is derived from the projected volatility regime, measured via vx1! and vx2! (cboe)

EMA/ATR/RSIThis indicator overlays three key technical measures—Exponential Moving Average (EMA), Average True Range (ATR), and a custom-scaled Relative Strength Index (RSI)—on your price chart, all using the same lookback period.
Features
• EMA (Exponential Moving Average): Smooths price action to highlight trend direction.
• ATR (Average True Range): Measures market volatility via an RMA-smoothed True Range.
• RSI (Modified): Scales the standard RSI by subtracting 35 and multiplying by 2, shifting the baseline for clearer momentum signals.
Inputs
• period (integer): Lookback length for EMA, ATR, and RSI calculations (default: 14).
How to Use
1. Adjust period to suit your preferred timeframe (e.g., 14 for daily charts, 7 for intraday).
2. Use the EMA line to identify trend direction and dynamic support/resistance.
3. Monitor ATR to gauge changing volatility—wider bands signal stronger moves.
4. Watch the modified RSI crossovers around zero:
• Above 0: Bullish momentum
• Below 0: Bearish momentum
Combine these three overlays to refine entries, exits, and stop-loss placement based on trend strength, volatility, and momentum all in one view.

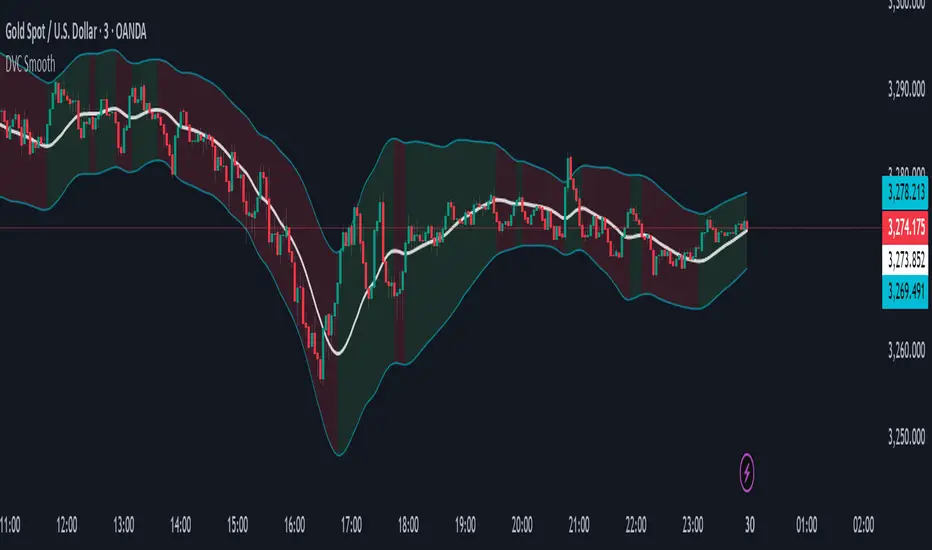
Dynamic Volatility Channel (DVC) - Smooth
The indicator's adaptability comes from a unique blend of well-known concepts:
The Adaptive Engine (ADX): The indicator uses the Average Directional Index (ADX) in the background to analyze the strength of the trend. This acts as the "brain", telling the channel whether the market is trending strongly or moving sideways.
Hybrid Volatility: This is the core of the indicator. The width of the channel is determined by a weighted mix of two volatility measures:
In trending markets (high ADX), the channel gives more weight to the Average True Range (ATR).
In ranging markets (low ADX), the channel gives more weight to Standard Deviation.
Smooth Centerline (HMA): The channel is centered around a Hull Moving Average (HMA), which is known for its smoothness and reduced lag compared to other moving averages.
Advanced Smoothing Layers: This version includes dedicated smoothing for both the volatility components (ATR and StDev) and the logic that switches between regimes. This ensures the channel expands, contracts, and adapts in a very fluid manner, eliminating sudden jumps and reducing market noise.
Mean Reversion: In ranging markets (indicated by a flatter channel), the outer bands can act as dynamic support and resistance levels. Look for opportunities to sell near the upper band and buy near the lower band, always waiting for price action confirmation like reversal candles.
Trend Following: In strong trends (indicated by a steeply sloped channel), the centerline (HMA) often serves as a dynamic level of support (in an uptrend) or resistance (in a downtrend). Pullbacks to the centerline can present opportunities to join the trend. A "band ride," where price action consistently pushes against the upper or lower band, signals a very strong trend.
Volatility Analysis: A "squeeze," where the bands come very close together, indicates low volatility and can foreshadow a significant price breakout. A sudden expansion of the bands signals an increase in volatility and the potential start of a new, powerful move.
All core parameters are fully customizable to suit your trading style and preferred assets:
You can adjust the lengths for the HMA, ATR, StDev, and the ADX filter.
You can change the multipliers for the ATR and Standard Deviation components.
Crucially, you can control the Volatility Smoothing Length and Logic Smoothing Length to find the perfect balance between responsiveness and smoothness.
Disclaimer: This indicator is provided for educational and analytical purposes only. It is not financial advice, and past performance is not indicative of future results. Always conduct your own research and backtesting before risking capital in a live market.
Doji Ashi v2.0 (with SL & TP levels)This is a version of @SassyStonks Doji Ashi v2.0 that includes ATR based SL levels with adjustable R:R TP levels.
What is Doji Ashi v2.0?
This indicator is designed for short-term intraday momentum trading, offering Buy and Sell signals based on a refined combination of filters including:
Trend alignment with daily SMAs
Momentum confirmation using EMA 3/8 cross
Relative volume to identify activity spikes
VWAP positioning to confirm trend consistency
Time filters to avoid unreliable early market chop
It adapts dynamically depending on whether you’re trading Stocks or Crypto, with appropriate filters toggled automatically.
...
How the Script Works
Core Logic:
A Buy signal appears when:
The price is in an uptrend (via SMAs)
VWAP and volume confirm momentum
EMA 3 crosses above EMA 8
Relative strength is strong (if enabled)
Market opens past first 30 mins
A Sell signal appears when:
The asset shows weakness across these same filters, in reverse
You’ll see green “BUY” or red “SELL” markers on your chart instantly when the full condition set is met. This script does not repaint.
Entry Logic Options:
Choose between:
"Cross" mode: Signals appear on 3/8 EMA crossover
"Above/Below" mode: Persistent signal while 3 EMA stays above/below 8 EMA
...
Strategy for Consistent Gains
This script works best on liquid stocks such as LUNR, ASTS and PLUG. It also works with Crypto. Make sure you choose the correct indicator setup type (Stocks or Crypto) in the setting before testing.
If you don't see any signals the default settings may be too strict for your chosen stock. Have a play with the settings to find the right balance for you. The default settings follow the strategy below for what I believe are currently the best results.
Alerts for buy/sell signals can be set from the alerts menu. For best results, make sure you set the alert to action on close of bar.
This indicator is most effective when:
Used with liquid stocks or crypto
Entries are confirmed with VWAP, not counter-trend
Signals are filtered by volume spikes and trend direction
Example strategy:
Buy a Call when you see a BUY signal with high volume, in an uptrend
Exit on a cross back to VWAP (the orange line) or a quick 1% profit
Do the opposite with PUTs on a SELL signal
This is ideal for quick day trades (scalps or trend moves), and avoids the choppy, uncertain zones at market open.
...
Optimizing via Settings
There are additional, stricter filters in the settings. Please adapt to your preference.
Presets:
Stocks (Default): Applies all filters but lets you disable them as needed
Crypto: Disables stock-specific filters (SPY comparison, RS, Daily trend)
Filters:
Daily Trend Filter: Helps align trades with higher timeframe direction (recommended ON for stocks)
Market Trend & RS: Filters based on SPY and relative performance (test enabling for SPY-following tickers)
VWAP Entry Filter: Keeps you from fighting the dominant intraday trend
Ignore First 30 Minutes: Avoids false signals at the open
Experiment with toggling filters ON/OFF to match your asset class and volatility conditions.
...
Finally
The best way to master this indicator is to understand the trading mindset it came from.
Read The Damn Wiki — it’s free, comprehensive, and packed with wisdom that this script distills into a usable tool.
If you would like to adapt this indicator you are very welcome to do so. All I ask in return is that you share your findings with the wider community.
...
Happy trading. May your entries be sharp and your exits cleaner.
~ @SassyStonks

Key Metrics Dashboard (Float, MCap, ATR) (ValueRay)This dashboard displays critical fundamental and volatility data, saving you from switching screens. It’s perfect for traders who need to quickly assess a stock's character, risk profile, and potential before making a move.
📊 Metrics Included
- Market Cap (MCap): Quickly gauge company size.
- Float: See tradable shares (color-coded for low-float stocks).
- Short %: Measure bearish sentiment and short-squeeze potential (color-coded).
- ATR % & ADR %: Understand true volatility to manage risk.
🚀 Key Features
- Fully Customizable: Toggle any metric on/off to create your ideal view.
- Flexible Layout: Choose your preferred on-chart position, size, and layout (horizontal or vertical).
- Lightweight & Clean: Get essential data without cluttering your chart.
If you find this indicator useful, please give it a Boost (🚀)!
Happy Trading

KST Strategy [Skyrexio]Overview
KST Strategy leverages Know Sure Thing (KST) indicator in conjunction with the Williams Alligator and Moving average to obtain the high probability setups. KST is used for for having the high probability to enter in the direction of a current trend when momentum is rising, Alligator is used as a short term trend filter, while Moving average approximates the long term trend and allows trades only in its direction. Also strategy has the additional optional filter on Choppiness Index which does not allow trades if market is choppy, above the user-specified threshold. Strategy has the user specified take profit and stop-loss numbers, but multiplied by Average True Range (ATR) value on the moment when trade is open. The strategy opens only long trades.
Unique Features
ATR based stop-loss and take profit. Instead of fixed take profit and stop-loss percentage strategy utilizes user chosen numbers multiplied by ATR for its calculation.
Configurable Trading Periods. Users can tailor the strategy to specific market windows, adapting to different market conditions.
Optional Choppiness Index filter. Strategy allows to choose if it will use the filter trades with Choppiness Index and set up its threshold.
Methodology
The strategy opens long trade when the following price met the conditions:
Close price is above the Alligator's jaw line
Close price is above the filtering Moving average
KST line of Know Sure Thing indicator shall cross over its signal line (details in justification of methodology)
If the Choppiness Index filter is enabled its value shall be less than user defined threshold
When the long trade is executed algorithm defines the stop-loss level as the low minus user defined number, multiplied by ATR at the trade open candle. Also it defines take profit with close price plus user defined number, multiplied by ATR at the trade open candle. While trade is in progress, if high price on any candle above the calculated take profit level or low price is below the calculated stop loss level, trade is closed.
Strategy settings
In the inputs window user can setup the following strategy settings:
ATR Stop Loss (by default = 1.5, number of ATRs to calculate stop-loss level)
ATR Take Profit (by default = 3.5, number of ATRs to calculate take profit level)
Filter MA Type (by default = Least Squares MA, type of moving average which is used for filter MA)
Filter MA Length (by default = 200, length for filter MA calculation)
Enable Choppiness Index Filter (by default = true, setting to choose the optional filtering using Choppiness index)
Choppiness Index Threshold (by default = 50, Choppiness Index threshold, its value shall be below it to allow trades execution)
Choppiness Index Length (by default = 14, length used in Choppiness index calculation)
KST ROC Length #1 (by default = 10, value used in KST indicator calculation, more information in Justification of Methodology)
KST ROC Length #2 (by default = 15, value used in KST indicator calculation, more information in Justification of Methodology)
KST ROC Length #3 (by default = 20, value used in KST indicator calculation, more information in Justification of Methodology)
KST ROC Length #4 (by default = 30, value used in KST indicator calculation, more information in Justification of Methodology)
KST SMA Length #1 (by default = 10, value used in KST indicator calculation, more information in Justification of Methodology)
KST SMA Length #2 (by default = 10, value used in KST indicator calculation, more information in Justification of Methodology)
KST SMA Length #3 (by default = 10, value used in KST indicator calculation, more information in Justification of Methodology)
KST SMA Length #4 (by default = 15, value used in KST indicator calculation, more information in Justification of Methodology)
KST Signal Line Length (by default = 10, value used in KST indicator calculation, more information in Justification of Methodology)
User can choose the optimal parameters during backtesting on certain price chart.
Justification of Methodology
Before understanding why this particular combination of indicator has been chosen let's briefly explain what is KST, Williams Alligator, Moving Average, ATR and Choppiness Index.
The KST (Know Sure Thing) is a momentum oscillator developed by Martin Pring. It combines multiple Rate of Change (ROC) values, smoothed over different timeframes, to identify trend direction and momentum strength. First of all, what is ROC? ROC (Rate of Change) is a momentum indicator that measures the percentage change in price between the current price and the price a set number of periods ago.
ROC = 100 * (Current Price - Price N Periods Ago) / Price N Periods Ago
In our case N is the KST ROC Length inputs from settings, here we will calculate 4 different ROCs to obtain KST value:
KST = ROC1_smooth × 1 + ROC2_smooth × 2 + ROC3_smooth × 3 + ROC4_smooth × 4
ROC1 = ROC(close, KST ROC Length #1), smoothed by KST SMA Length #1,
ROC2 = ROC(close, KST ROC Length #2), smoothed by KST SMA Length #2,
ROC3 = ROC(close, KST ROC Length #3), smoothed by KST SMA Length #3,
ROC4 = ROC(close, KST ROC Length #4), smoothed by KST SMA Length #4
Also for this indicator the signal line is calculated:
Signal = SMA(KST, KST Signal Line Length)
When the KST line rises, it indicates increasing momentum and suggests that an upward trend may be developing. Conversely, when the KST line declines, it reflects weakening momentum and a potential downward trend. A crossover of the KST line above its signal line is considered a buy signal, while a crossover below the signal line is viewed as a sell signal. If the KST stays above zero, it indicates overall bullish momentum; if it remains below zero, it points to bearish momentum. The KST indicator smooths momentum across multiple timeframes, helping to reduce noise and provide clearer signals for medium- to long-term trends.
Next, let’s discuss the short-term trend filter, which combines the Williams Alligator and Williams Fractals. Williams Alligator
Developed by Bill Williams, the Alligator is a technical indicator that identifies trends and potential market reversals. It consists of three smoothed moving averages:
Jaw (Blue Line): The slowest of the three, based on a 13-period smoothed moving average shifted 8 bars ahead.
Teeth (Red Line): The medium-speed line, derived from an 8-period smoothed moving average shifted 5 bars forward.
Lips (Green Line): The fastest line, calculated using a 5-period smoothed moving average shifted 3 bars forward.
When the lines diverge and align in order, the "Alligator" is "awake," signaling a strong trend. When the lines overlap or intertwine, the "Alligator" is "asleep," indicating a range-bound or sideways market. This indicator helps traders determine when to enter or avoid trades.
The next indicator is Moving Average. It has a lot of different types which can be chosen to filter trades and the Least Squares MA is used by default settings. Let's briefly explain what is it.
The Least Squares Moving Average (LSMA) — also known as Linear Regression Moving Average — is a trend-following indicator that uses the least squares method to fit a straight line to the price data over a given period, then plots the value of that line at the most recent point. It draws the best-fitting straight line through the past N prices (using linear regression), and then takes the endpoint of that line as the value of the moving average for that bar. The LSMA aims to reduce lag and highlight the current trend more accurately than traditional moving averages like SMA or EMA.
Key Features:
It reacts faster to price changes than most moving averages.
It is smoother and less noisy than short-term EMAs.
It can be used to identify trend direction, momentum, and potential reversal points.
ATR (Average True Range) is a volatility indicator that measures how much an asset typically moves during a given period. It was introduced by J. Welles Wilder and is widely used to assess market volatility, not direction.
To calculate it first of all we need to get True Range (TR), this is the greatest value among:
High - Low
abs(High - Previous Close)
abs(Low - Previous Close)
ATR = MA(TR, n) , where n is number of periods for moving average, in our case equals 14.
ATR shows how much an asset moves on average per candle/bar. A higher ATR means more volatility; a lower ATR means a calmer market.
The Choppiness Index is a technical indicator that quantifies whether the market is trending or choppy (sideways). It doesn't indicate trend direction — only the strength or weakness of a trend. Higher Choppiness Index usually approximates the sideways market, while its low value tells us that there is a high probability of a trend.
Choppiness Index = 100 × log10(ΣATR(n) / (MaxHigh(n) - MinLow(n))) / log10(n)
where:
ΣATR(n) = sum of the Average True Range over n periods
MaxHigh(n) = highest high over n periods
MinLow(n) = lowest low over n periods
log10 = base-10 logarithm
Now let's understand how these indicators work in conjunction and why they were chosen for this strategy. KST indicator approximates current momentum, when it is rising and KST line crosses over the signal line there is high probability that short term trend is reversing to the upside and strategy allows to take part in this potential move. Alligator's jaw (blue) line is used as an approximation of a short term trend, taking trades only above it we want to avoid trading against trend to increase probability that long trade is going to be winning.
Almost the same for Moving Average, but it approximates the long term trend, this is just the additional filter. If we trade in the direction of the long term trend we increase probability that higher risk to reward trade will hit the take profit. Choppiness index is the optional filter, but if it turned on it is used for approximating if now market is in sideways or in trend. On the range bounded market the potential moves are restricted. We want to decrease probability opening trades in such condition avoiding trades if this index is above threshold value.
When trade is open script sets the stop loss and take profit targets. ATR approximates the current volatility, so we can make a decision when to exit a trade based on current market condition, it can increase the probability that strategy will avoid the excessive stop loss hits, but anyway user can setup how many ATRs to use as a stop loss and take profit target. As was said in the Methodology stop loss level is obtained by subtracting number of ATRs from trade opening candle low, while take profit by adding to this candle's close.
Backtest Results
Operating window: Date range of backtests is 2023.01.01 - 2025.05.01. It is chosen to let the strategy to close all opened positions.
Commission and Slippage: Includes a standard Binance commission of 0.1% and accounts for possible slippage over 5 ticks.
Initial capital: 10000 USDT
Percent of capital used in every trade: 60%
Maximum Single Position Loss: -5.53%
Maximum Single Profit: +8.35%
Net Profit: +5175.20 USDT (+51.75%)
Total Trades: 120 (56.67% win rate)
Profit Factor: 1.747
Maximum Accumulated Loss: 1039.89 USDT (-9.1%)
Average Profit per Trade: 43.13 USDT (+0.6%)
Average Trade Duration: 27 hours
These results are obtained with realistic parameters representing trading conditions observed at major exchanges such as Binance and with realistic trading portfolio usage parameters.
How to Use
Add the script to favorites for easy access.
Apply to the desired timeframe and chart (optimal performance observed on 1h BTC/USDT).
Configure settings using the dropdown choice list in the built-in menu.
Set up alerts to automate strategy positions through web hook with the text: {{strategy.order.alert_message}}
Disclaimer:
Educational and informational tool reflecting Skyrexio commitment to informed trading. Past performance does not guarantee future results. Test strategies in a simulated environment before live implementation.

ATR Rangeshows the high and low of the given range of the asset base on the daily atr fixed by the weekly trend.

ATR Buy, Target, Stop + OverlayATR Buy, Target, Stop + Overlay
This tool is to assist traders with precise trade planning using the Average True Range (ATR) as a volatility-based reference.
This script plots buy, target, and stop-loss levels on the chart based on a user-defined buy price and ATR-based multipliers, allowing for objective and adaptive trade management.
*NOTE* In order for the indicator to initiate plotted lines and table values a non-zero number must be entered into the settings.
What It Does:
Buy Price Input: Users enter a manual buy price (e.g., an executed or planned trade entry).
ATR-Based Target and Stop: The script calculates:
Target Price = Buy + (ATR × Target Multiplier)
Stop Price = Buy − (ATR × Stop Multiplier)
Customizable Timeframe: Optionally override the ATR timeframe (e.g., use daily ATR on a 1-hour chart).
Visual Overlay: Lines are drawn directly on the price chart for the Buy, Target, and Stop levels.
Interactive Table: A table is displayed with relevant levels and ATR info.
Customization Options:
Line Settings:
Adjust color, style (solid/dashed/dotted), and width for Buy, Target, and Stop lines.
Choose whether to extend lines rightward only or in both directions.
Table Settings:
Choose position (top/bottom, left/right).
Toggle individual rows for Buy, Target, Stop, ATR Timeframe, and ATR Value.
Customize text color and background transparency.
How to Use It for Trading:
Plan Your Trade: Enter your intended buy price when planning a trade.
Assess Risk/Reward: The script immediately visualizes the potential stop-loss and target level, helping assess R:R ratios.
Adapt to Volatility: Use ATR-based levels to scale stop and target dynamically depending on current market volatility.
Higher Timeframe ATR: Select a different timeframe for the ATR calculation to smooth noise on lower timeframe charts.
On-the-Chart Reference: Visually track trade zones directly on the price chart—ideal for live trading or strategy backtesting.
Ideal For:
Swing traders and intraday traders
Risk management and trade planning
Traders using ATR-based exits or scaling
Visualizing asymmetric risk/reward setups
How I Use This:
After entering a trade, adding an entry price will plot desired ATR target and stop level for visualization.
Adjusting ATR multiplier values assists in evaluating and planning trades.
Visualization assists in comparing ATR multiples to recent support and resistance levels.

ATR FX DashboardATR FX Dashboard – Multi-Timeframe Volatility Monitor
Overview:
The ATR FX Dashboard provides a quick, at-a-glance view of market volatility across multiple timeframes for any forex pair. It uses the well-known Average True Range (ATR) indicator to display real-time volatility information in both pips and percentage terms, helping traders assess potential risk, position sizing, and market conditions.
How It Works:
This dashboard displays:
✔ ATR in Pips — The average price movement over a given timeframe, converted to pips for easy interpretation, automatically adjusting for JPY pairs.
✔ ATR as a Percentage of Price — Shows how significant the ATR is relative to the current price. Higher percentages often signal higher volatility or more active markets.
✔ Color-Coded Volatility Highlights — On the daily timeframe, ATR % cells are color-coded:
Green: High volatility
Orange: Moderate volatility
Red: Low volatility
Timeframes Displayed:
15 Minutes
1 Hour
4 Hour
Daily
This gives traders a clear, multi-timeframe view of short-term and broader market volatility conditions, directly on the chart.
Ideal For:
✅ Forex traders seeking quick, reliable volatility reference points
✅ Day traders and swing traders needing help with risk assessment and position sizing
✅ Anyone using ATR-based strategies or simply wanting to stay aware of changing market conditions
Additional Features:
Toggle option to display or hide ATR % relative to price
Automatic pip conversion for JPY pairs
Simple, clean table layout in the bottom-right corner of the chart
Supports all forex symbols
Disclaimer:
This tool is for informational purposes only and is not financial advice. As with all technical indicators, it should be used in conjunction with other tools and proper risk management.

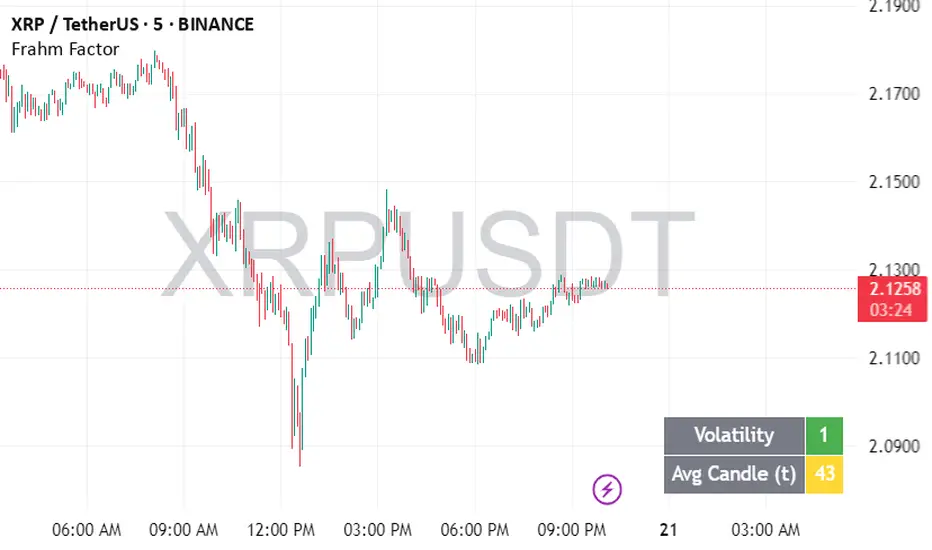
Frahm FactorIntended Usage of the Frahm Factor Indicator
The Frahm Factor is designed to give you a rapid, at-a-glance assessment of how volatile the market is right now—and how large the average candle has been—over the most recent 24-hour window. Here’s how to put it to work:
Gauge Volatility Regimes
Volatility Score (1–10)
A low score (1–3, green) signals calm seas—tight ranges, low risk of big moves.
A mid score (4–6, yellow) warns you that volatility is picking up.
A high score (7–10, red) tells you to prepare for disorderly swings or breakout opportunities.
How to trade off it
In low-volatility periods, you might favor mean-reversion or range-bound strategies.
As the score climbs into the red zone, consider widening stops, scaling back position size, or switching to breakout momentum plays.
Monitor Average Candle Size
Avg Candle (ticks) cell shows you the mean true-range of each bar over that 24h window in ticks.
When candles are small, you know the market is consolidating and liquidity may be thin.
When candles are large, momentum and volume are driving strong directional bias.
The optional dynamic color ramp (green→yellow→red) immediately flags when average bar size is unusually small or large versus its own 24h history.
Customize & Stay Flexible
Timeframes: Works on any intraday chart—from 1-minute scalping to 4-hour swing setups—because it always looks back exactly 24 hours.
Toggles:
Show or hide the Volatility and Avg-Candle cells to keep your screen uncluttered.
Turn on the dynamic color ramp only when you want that extra visual cue.
Alerts: Built-in alerts fire automatically at meaningful thresholds (Volatility ≥ 8 or ≤ 3), so you’ll never miss regime shifts, even if you step away.
Real-World Applications
Risk Management: Automatically adjust your stop-loss distances or position sizing based on the current volatility band.
Strategy Selection: Flip between range-trading and momentum strategies as the volatility regime changes.
Session Analysis: Pinpoint when during the day volatility typically ramps—perfect for doorway sessions like London opening or the US midday news spikes.
Bottom line: the Frahm Factor gives you one compact dashboard to see the pulse of the market—so you can make choices with conviction, dial your risk in real time, and never be caught off guard by sudden volatility shifts.
Logic Behind the Frahm Factor Indicator
24-Hour Rolling Window
On every intraday bar, we append that bar’s True Range (TR) and timestamp to two arrays.
We then prune any entries older than 24 hours, so the arrays always reflect exactly the last day of data.
Volatility Score (1–10)
We count how many of those 24 h TR values are less than or equal to the current bar’s TR.
Dividing by the total array size gives a percentile (0–1), which we scale and round into a 1–10 score.
Average Candle Size (ticks)
We sum all TR values in the same 24 h window, divide by array length to get the mean TR, then convert that price range into ticks.
Optionally, a green→yellow→red ramp highlights when average bar size is unusually small, medium or large versus its own 24 h history.
Color & Alerts
The Volatility cell flips green (1–3), yellow (4–6) or red (7–10) so you see regime shifts at a glance.
Built-in alertcondition calls fire when the score crosses your high (≥ 8) or low (≤ 3) thresholds.
Modularity
Everything—table location, which cells to show, dynamic coloring—is controlled by simple toggles, so you can strip it back or layer on extra visual cues as needed.
That’s the full recipe: a true 24 h look-back, a percentile-ranked volatility gauge, and a mean-bar-size meter, all wrapped into one compact dashboard.
Adaptive RSI (ARSI)# Adaptive RSI (ARSI) - Dynamic Momentum Oscillator
Adaptive RSI is an advanced momentum oscillator that dynamically adjusts its calculation period based on real-time market volatility and cycle analysis. Unlike traditional RSI that uses fixed periods, ARSI continuously adapts to market conditions, providing more accurate overbought/oversold signals and reducing false signals during varying market phases.
## How It Works
At its core, ARSI calculates an adaptive period ranging from 8 to 28 bars using two key components: volatility measurement through Average True Range (ATR) and cycle detection via price momentum analysis. The logic is straightforward:
- **High volatility periods** trigger shorter calculation periods for enhanced responsiveness to rapid price movements
- **Low volatility periods** extend the calculation window for smoother, more reliable signals
- **Market factor** combines volatility and cycle analysis to determine optimal RSI period in real-time
When RSI crosses above 70, the market enters overbought territory. When it falls below 30, oversold conditions emerge. The indicator also features extreme levels at 80/20 for stronger reversal signals and midline crossovers at 50 for trend confirmation.
The adaptive mechanism ensures the oscillator remains sensitive during critical market movements while filtering out noise during consolidation phases, making it superior to static RSI implementations across different market conditions.
## Features
- **True Adaptive Calculation**: Dynamic period adjustment from 8-28 bars based on market volatility
- **Multiple Signal Types**: Overbought/oversold, extreme reversals, and midline crossovers
- **Configurable Parameters**: RSI length, adaptive sensitivity, ATR period, min/max bounds
- **Smart Smoothing**: Adjustable EMA smoothing from 1-21 periods to reduce noise
- **Visual Clarity**: Gradient colors, area fills, and signal dots for immediate trend recognition
- **Real-time Information**: Live data table showing current RSI, adaptive period, and market factor
- **Flexible Source Input**: Apply to any price source (close, hl2, ohlc4, etc.)
- **Professional Alerts**: Six built-in alert conditions for automated trading systems
## Signal Generation
ARSI generates multiple signal types for comprehensive market analysis:
**Primary Signals**: RSI crosses above 70 (overbought) or below 30 (oversold) - most reliable entry/exit points
**Extreme Signals**: RSI reaches 80+ (extreme overbought) or 20- (extreme oversold) - potential reversal zones
**Trend Signals**: RSI crosses above/below 50 midline - confirms directional momentum
**Reversal Signals**: Price action contradicts extreme RSI levels - early turning point detection
The adaptive period changes provide additional confirmation - signals accompanied by significant period shifts often carry higher probability of success.
## Visual Implementation
The indicator employs sophisticated visual elements for instant market comprehension:
- **Gradient RSI Line**: Color intensity reflects both value and momentum direction
- **Dynamic Zones**: Overbought/oversold areas with customizable fill colors
- **Signal Markers**: Triangular indicators mark key reversal and continuation points
- **Information Panel**: Real-time display of RSI value, adaptive period, market factor, and signal status
- **Background Coloring**: Subtle fills indicate current market state without chart clutter
## Parameter Configuration
**RSI Settings**:
- RSI Length: Base calculation period (default: 14)
- Adaptive Sensitivity: Response aggressiveness to volatility changes (default: 1.0)
- ATR Length: Volatility measurement period (default: 14)
- Min/Max Period: Adaptive calculation boundaries (default: 8/28)
- Smoothing Length: Final noise reduction filter (default: 3)
**Level Settings**:
- Overbought/Oversold: Standard signal levels (default: 70/30)
- Extreme Levels: Enhanced reversal zones (default: 80/20)
- Midline Display: 50-level trend confirmation toggle
**Visual Settings**:
- Line Width: RSI line thickness (1-5)
- Area Fills: Zone highlighting toggle
- Gradient Colors: Dynamic color intensity
- Signal Dots: Entry/exit marker display
## Alerts
ARSI includes six comprehensive alert conditions:
- **ARSI Overbought** - RSI crosses above overbought level
- **ARSI Oversold** - RSI crosses below oversold level
- **ARSI Bullish Cross** - RSI crosses above 50 midline
- **ARSI Bearish Cross** - RSI crosses below 50 midline
- **ARSI Extreme Bull** - Potential bullish reversal from extreme oversold
- **ARSI Extreme Bear** - Potential bearish reversal from extreme overbought
## Use Cases
**Trend Following**: Adaptive periods naturally adjust during trend acceleration and consolidation phases
**Mean Reversion**: Enhanced overbought/oversold signals with volatility-based confirmation
**Breakout Trading**: Extreme level breaches often precede significant directional moves
**Risk Management**: Multiple signal types allow for layered entry/exit strategies
**Multi-Timeframe Analysis**: Works effectively across various timeframes and asset classes
## Trading Applications
**Swing Trading**: Excels during trend transitions with adaptive sensitivity to changing conditions
**Day Trading**: Enhanced responsiveness during volatile sessions while filtering consolidation noise
**Position Trading**: Longer smoothing periods provide stable signals for broader market analysis
**Scalping**: Minimal smoothing with high sensitivity captures short-term momentum shifts
The indicator performs well across stocks, forex, commodities, and cryptocurrencies, though parameter optimization may be required for specific market characteristics.
## Settings Summary
**Display Settings**:
- RSI Length: Moving average baseline period
- Adaptive Sensitivity: Volatility response factor
- ATR Length: Volatility measurement window
- Min/Max Period: Adaptive calculation boundaries
- Smoothing Length: Noise reduction filter
**Level Configuration**:
- Overbought/Oversold: Primary signal thresholds
- Extreme Levels: Secondary reversal zones
- Midline Display: Trend confirmation toggle
**Visual Options**:
- Line Width: RSI line appearance
- Area Fills: Zone highlighting
- Gradient Colors: Dynamic visual feedback
- Signal Dots: Entry/exit markers
## Disclaimer
This indicator is provided for educational and informational purposes only. It is not financial advice. Trading involves substantial risk of loss and is not suitable for all investors. Past performance is not indicative of future results. Always conduct thorough testing and risk assessment before live implementation. The adaptive nature of this indicator requires understanding of its behavior across different market conditions for optimal results.

ATR Screener with Labels and ShapesWeekly Daily ATR Pine Scanner
To find out tightness or contraction in a stock we needs to check if volatality is decreasing as well as compared to previous 14 or 10 bars volatility . we check this for weekly and then for Daily , so that we can enter in a stock which is tightest in recent times.
Condition is :
1. Weekly Candle ATR x 0.8 < 10 Week ATR
2. Daily Candle ATR x 0.6 < 14 Day ATR
When both of the conditions are met then they signifies that the stock has tightened in weekly and daily aswell . so now we can find ways to enter during max squeeze.
How to scan in Pine Scanner ?
FIrst add indicator as favourite and Go to pine scanner page in trading view and then scan your watchlist and there you will see 3 columns 1 with only Weekly conditions met , 2 with only Daily and 3rd with Both conditions met .
Select stocks and move to new watchlist and now you have those stocks which has contracted the most in recent times .

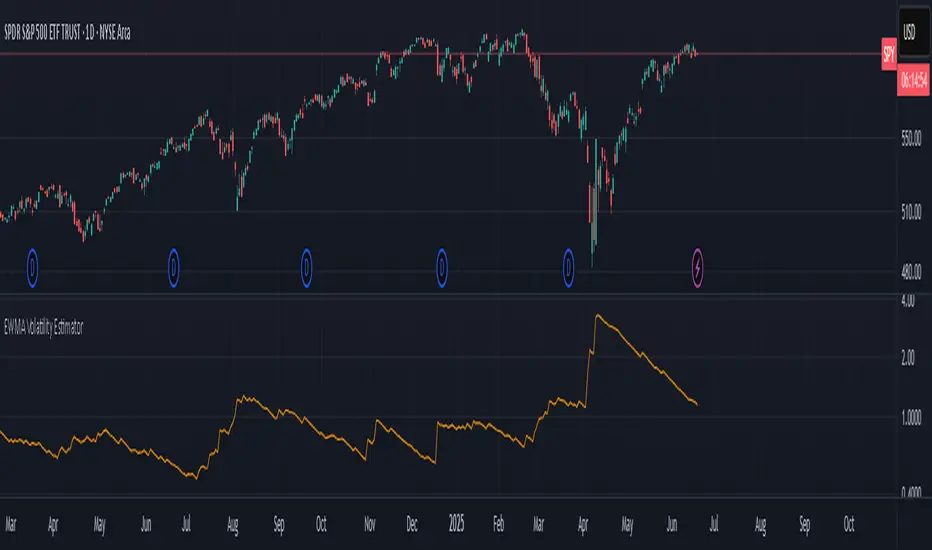
EWMA Volatility EstimatorThis script calculates EWMA Volatility (Exponentially Weighted Moving Average Volatility).
Commonly used model in financial risk management.
It estimates recent price volatility by applying more weight to the most recent returns, capturing volatility clustering while remaining responsive to fast market shifts.
The method uses a decay factor (λ) of 0.94, the standard value used in models like RiskMetrics, and converts the variance estimate into annualized volatility in percentage terms.
This is not a forecasting tool. It’s an estimator that reflects the magnitude of recent price moves in a statistically robust way.
It can be helpful for:
Understanding regime shifts in market behavior
Designing position sizing rules based on recent volatility
Filtering entries during high or low volatility phases
How It Works
Computes log returns of the closing price.
Squares the returns to get a proxy for variance.
Applies an exponential moving average to the squared returns using an equivalent EMA period based on λ = 0.94.
Converts the result to volatility by taking the square root and scaling to a percentage.
Key Characteristics
Backward-looking estimator
Reacts faster than standard rolling-window volatility
Smooths noise while still being sensitive to recent spikes
This script is educational and informational. It is not financial advice or a guarantee of performance. Always test any tool as part of a broader strategy before using it in live markets.
ATR % Line from Day LowHow can you make sure that you're not buying a stock that is too extended?
By limiting your buys to within a certain percentage of either the low-of-the-day (LoD) if you're going long, or to the high-of-the-day (HoD) if you're shorting a stock. This script will help you do just that.
Limiting stock purchases to within a certain percentage of the Average True Range (ATR) from the day's low or high is a risk management technique that offers several key benefits:
Risk Control and Position Sizing
By using ATR as a boundary, you're essentially creating a volatility-adjusted buffer. Since ATR measures recent price volatility, this approach prevents you from buying into stocks that have already moved significantly beyond their normal trading range. This helps avoid entering positions when the stock might be overextended and due for a pullback.
Improved Entry Timing
This strategy encourages patience and discipline. Rather than chasing a stock that's already run up substantially from its low, you wait for better entry points. For example, if you set a limit of 50% of ATR from the day's low, you're only buying when the stock hasn't moved more than half its typical daily range from the bottom.
Volatility Awareness
ATR naturally adjusts for each stock's individual volatility characteristics. A high-volatility stock might have an ATR of $2, while a low-volatility stock might have an ATR of $0.50. This approach scales your entry criteria appropriately for each security rather than using arbitrary dollar amounts.
Reduced Emotional Trading
Having a systematic rule removes the temptation to chase momentum or buy at poor technical levels. It forces you to wait for the stock to come back to more reasonable levels relative to its recent trading behavior.
Better Risk-Reward Ratios
By entering closer to the day's low (within your ATR percentage), you're typically getting a better risk-reward setup. Your stop loss (often placed below the day's low) will be tighter, while your potential upside remains intact.
This approach works particularly well for swing traders and those looking to enter positions on pullbacks or during consolidation periods rather than breakout scenarios.
To save valuable real estate on your chart, there's also an option that can give you a compact version of this indicator which will show only the "Current Day's Low/High" and "Target Price". "Target Price" being the price at which your max buy limit is based on the % ATR you choose in settings.

X-Day Capital Efficiency ScoreThis indicator helps identify the Most Profitable Movers for Your fixed Capital (ie, which assets offer the best average intraday profit potential for a fixed capital).
Unlike traditional volatility indicators (like ATR or % change), this script calculates how much real dollar profit you could have made each day over a custom lookback period — assuming you deployed your full capital into that ticker daily.
How it works:
Calculates the daily intraday range (high − low)
Filters for clean candles (where body > 60% of the candle range)
Assumes you invested the full amount of capital ($100K set as default) on each valid day
Computes an average daily profit score based on price action over the selected period (default set to 20 days)
Plots the score in dollars — higher = more efficient use of capital
Why It’s Useful:
Compare tickers based on real dollar return potential — not just % volatility
Spot low-priced, high-volatility stocks that are better suited for intraday or momentum trading
Inputs:
Capital ($): Amount you're hypothetically deploying (e.g., 100,000)
Look Back Period: Number of past days to average over (e.g., 20)

ATR-Multiple from 50SMAThis indicator provides a nuanced view of price extension by calculating the distance between the current price and its 50-period Simple Moving Average. This distance is not measured in simple percentage terms but is quantified in multiples of the Average True Range (ATR), offering a volatility-adjusted perspective on how far an asset has moved from its mean.
The primary goal is to help traders identify potentially overextended conditions, which can often precede price consolidation or reversals. As a general guideline, when an asset's price stretches to multiples of 7 ATRs or more above its 50-day SMA, it often enters a zone where significant profit-taking may occur. By visualizing this extension, the indicator can serve as a powerful tool for gauging when to consider taking profits on existing long positions. Furthermore, it can act as a cautionary signal, helping traders avoid initiating new long positions in assets that are already significantly stretched and may be poised for a pullback.
Features
Volatility-Adjusted Extension
Measures the distance from the 50 SMA in terms of ATR multiples, providing a more standardized way to compare extension across different assets and time periods.
Daily Timeframe Consistency
By default, the indicator uses the daily SMA and ATR for its calculations, regardless of the chart's current timeframe. This ensures a consistent and meaningful measure of extension rooted in the daily trend.
Histogram Visualization
Displays the result as a clear histogram in a separate pane, making it easy to track the extension level over time and identify historical extremes.
Dynamic Color-Coding
The histogram bars are color-coded to visually highlight different levels of extension. The colors shift as the price moves further from the mean, providing an intuitive at-a-glance reading.
Key Threshold Markers
Includes pre-set horizontal lines at the 7 and 10 ATR multiples to clearly mark the zones of potential profit-taking and extreme extension, respectively.
Built-in Alerts
Comes with configurable alert conditions that can notify you when the price reaches the "profit-taking" threshold (7 ATRs) or the "extreme extension" threshold (10 ATRs).
Customization Options
MA & ATR Periods
You can adjust the length for the Simple Moving Average (default 50) and the Average True Range (default 14) to suit your specific analytical needs.
Timeframe Source
A toggle allows you to switch between always calculating using daily data (the default and recommended setting) or using the data from the current chart's timeframe.
Color Display Style
You can choose between a smooth color gradient that transitions elegantly with the extension level or a distinct, step-based color display for a clearer visual separation of the defined zones.
Full Color Scheme Control
Every visual element is fully customizable. You can change the colors for the regular extension, the "get ready," "profit-taking," and "extreme" levels, as well as the horizontal reference lines.

Multi TF Oscillators Screener [TradingFinder] RSI / ATR / Stoch🔵 Introduction
The oscillator screener is designed to simplify multi-timeframe analysis by allowing traders and analysts to monitor one or multiple symbols across their preferred timeframes—all at the same time. Users can track a single symbol through various timeframes simultaneously or follow multiple symbols in selected intervals. This flexibility makes the tool highly effective for analyzing diverse markets concurrently.
At the core of this screener lie two essential oscillators: RSI (Relative Strength Index) and the Stochastic Oscillator. The RSI measures the speed and magnitude of recent price movements and helps identify overbought or oversold conditions.
It's one of the most reliable indicators for spotting potential reversals. The Stochastic Oscillator, on the other hand, compares the current price to recent highs and lows to detect momentum strength and potential trend shifts. It’s especially effective in identifying divergences and short-term reversal signals.
In addition to these two primary indicators, the screener also displays helpful supplementary data such as the dominant candlestick type (Bullish, Bearish, or Doji), market volatility indicators like ATR and TR, and the four key OHLC prices (Open, High, Low, Close) for each symbol and timeframe. This combination of data gives users a comprehensive technical view and allows for quick, side-by-side comparison of symbols and timeframes.
🔵 How to Use
This tool is built for users who want to view the behavior of a single symbol across several timeframes simultaneously. Instead of jumping between charts, users can quickly grasp the state of a symbol like gold or Bitcoin across the 15-minute, 1-hour, and daily timeframes at a glance. This is particularly useful for traders who rely on multi-timeframe confirmation to strengthen their analysis and decision-making.
The tool also supports simultaneous monitoring of multiple symbols. Users can select and track various assets based on the timeframes that matter most to them. For example, if you’re looking for entry opportunities, the screener allows you to compare setups across several markets side by side—making it easier to choose the most favorable trade. Whether you’re a scalper focused on low timeframes or a swing trader using higher ones, the tool adapts to your workflow.
The screener utilizes the widely-used RSI indicator, which ranges from 0 to 100 and highlights market exhaustion levels. Readings above 70 typically indicate potential pullbacks, while values below 30 may suggest bullish reversals. Viewing RSI across timeframes can reveal meaningful divergences or alignments that improve signal quality.
Another key indicator in the screener is the Stochastic Oscillator, which analyzes the closing price relative to its recent high-low range. When the %K and %D lines converge and cross within the overbought or oversold zones, it often signals a momentum reversal. This oscillator is especially responsive in lower timeframes, making it ideal for spotting quick entries or exits.
Beyond these oscillators, the table includes other valuable data such as candlestick type (bullish, bearish, or doji), volatility measures like ATR and TR, and complete OHLC pricing. This layered approach helps users understand both market momentum and structure at a glance.
Ultimately, this screener allows analysts and traders to gain a full market overview with just one look—empowering faster, more informed, and lower-risk decision-making. It not only saves time but also enhances the precision and clarity of technical analysis.
🔵 Settings
🟣 Display Settings
Table Size : Lets you adjust the table’s visual size with options such as: auto, tiny, small, normal, large, huge.
Table Position : Sets the screen location of the table. Choose from 9 possible positions, combining vertical (top, middle, bottom) and horizontal (left, center, right) alignments.
🟣 Symbol Settings
Each of the 10 symbol slots comes with a full set of customizable parameters :
Enable Symbol : A checkbox to activate or hide each symbol from the table.
Symbol : Define or select the asset (e.g., XAUUSD, BTCUSD, EURUSD, etc.).
Timeframe : Set your desired timeframe for each symbol (e.g., 15, 60, 240, 1D).
RSI Length : Defines the period used in RSI calculation (default is 14).
Stochastic Length : Sets the period for the Stochastic Oscillator.
ATR Length : Sets the length used to calculate the Average True Range, a key volatility metric.
🔵 Conclusion
By combining powerful oscillators like RSI and Stochastic with full customization over symbols and timeframes, this tool provides a fast, flexible solution for technical analysts. Users can instantly monitor one or several assets across multiple timeframes without opening separate charts.
Individual configuration for each symbol, along with the inclusion of key metrics like candlestick type, ATR/TR, and OHLC prices, makes the tool suitable for a wide range of trading styles—from scalping to swing and position trading.
In summary, this screener enables traders to gain a clear, high-level view of various markets in seconds and make quicker, smarter, and lower-risk decisions. It saves time, streamlines analysis, and boosts overall efficiency and confidence in trading strategies.

Toolbar-FrenToolbar-Fren is a comprehensive, data-rich toolbar designed to present a wide array of key metrics in a compact and intuitive format. The core philosophy of this indicator is to maximize the amount of relevant, actionable data available to the trader while occupying minimal chart space. It leverages a dynamic color-coded system to provide at-a-glance insights into market conditions, instantly highlighting positive/negative values, trend strength, and proximity to important technical levels.
Features and Data Displayed
The toolbar displays a vertical column of critical data points, primarily calculated on the Daily timeframe to give a broader market context. Each cell is color-coded for quick interpretation.
DAY:
The percentage change of the current price compared to the previous day's close. The cell is colored green for a positive change and red for a negative one.
LOD:
The current price's percentage distance from the Low of the Day.
HOD
The current price's percentage distance from the High of the Day.
MA Distances (9/21 or 10/20, 50, 200)
These cells show how far the current price is from key Daily moving averages (MAs).
The values are displayed either as a percentage distance or as a multiple of the Average Daily Range (ADR), which can be toggled in the settings.
The cells are colored green if the price is above the corresponding MA (bullish) and red if it is below (bearish).
ADR
Shows the 14-period Average Daily Range as a percentage of the current price. The cell background uses a smooth gradient from green (low volatility) to red (high volatility) to visualize the current daily range expansion.
ADR%/50: A unique metric showing the distance from the Daily 50 SMA, measured in multiples of the 14-period Average True Range (ATR). This helps quantify how extended the price is from its mean. The cell is color-coded from green (close to the mean) to red (highly extended).
RSI
The standard 14-period Relative Strength Index calculated on the Daily timeframe. The background color changes to indicate potentially overbought (orange/red) or oversold (green) conditions.
ADX
The 14-period Average Directional Index (ADX) from the Daily timeframe, which measures trend strength. The cell is colored to reflect the strength of the trend (e.g., green for a strong trend, red for a weak/non-trending market). An arrow (▲/▼) is also displayed to indicate if the ADX value is sloping up or down.
User Customization
The indicator offers several options for personalization to fit your trading style and visual preferences:
MA Type
Choose between using Exponential Moving Averages (EMA 9/21) or Simple Moving Averages (SMA 10/20) for the primary MA calculations.
MA Distance Display
Toggle the display of moving average distances between standard percentage values and multiples of the Average Daily Range (ADR).
Display Settings
Fully customize the on-chart appearance by selecting the table's position (e.g., Top Right, Bottom Left) and the text size. An option for a larger top margin is also available.
Colors
Personalize the core Green, Yellow, Orange, and Red colors used throughout the indicator to match your chart's theme.
Technical Parameters
Fine-tune the length settings for the ADX and DI calculations.

ATR RopeATR Rope is inspired by DonovanWall's "Range Filter". It implements a similar concept of filtering out smaller market movements and adjusting only for larger moves. In addition, this indicator goes one step deeper by producing actionable zones to determine market state. (Trend vs. Consolidation)
> Background
When reading up on the Range Filter indicator, it reminded me exactly of a Rope stabilization drawing tool in a program I use frequently. Rope stabilization essentially attaches a fixed length "rope" to your cursor and an anchor point (Brush). As you move your cursor, you are pulling the brush behind it. The cursor (of course) will not pull the brush until the rope is fully extended, this behavior filters out jittery movements and is used to produce smoother drawing curves.
If compared visually side-by-side, you will notice that this indicator bears striking resemblance to its inspiration.
> Goal
Other than simply distinguishing price movements between meaningful and noise, this indicator strives to create a rigid structure to frame market movements and lack-there-of, such as when to anticipate trend, and when to suspect consolidation.
Since the indicator works based on an ATR range, the resulting ATR Channel does well to get reactions from price at its extremes. Naturally, when consolidating, price will remain within the channel, neither pushing the channel significantly up or down. Likewise, when trending, price will continue to push the channel in a single direction.
With the goal of keeping it quick and simple, this indicator does not do any smoothing of data feeds, and is simply based on the deviation of price from the central rope. Adjusting the rope when price extends past the threshold created by +/- ATR from the rope.
> Features & Behaviors
- ATR Rope
ATR Rope is displayed as a 3 color single line.
This can be considered the center line, or the directional line, whichever you'd prefer.
The main point of the Rope display is to indicate direction, however it also is factually the center of the current working range.
- ATR Rope Color
When the rope's value moves up, it changes to green (uptrend), when down, red (downtrend).
When the source crosses the rope, it turns blue (flat).
With these simple rules, we've formed a structure to view market movements.
- Consolidation Zones
Consolidation Zones generate from "Flat" areas, and extend into subsequent trend areas. Consolidation is simply areas where price has crossed the Rope and remains inside the range. Over these periods, the upper and lower values are accumulated and averaged together to form the "Consolidation Zone" values. These zones are draw live, so values are averaged as the flat areas progress and don't repaint, so all values seen historically are as they would appear live.
- ATR Channel
ATR Channel displays the upper and lower bounds of the working range.
When the source moves beyond this range, the rope is adjusted based on the distance from the source to the channel. This range can be extremely useful to view, but by default it is hidden.
> Application
This indicator is not created to provide signals, or serve as a "complete" system.
(People who didn't read this far will still comment for signals. :) )
This is created to be used alongside manual interpretation and intuition. This indicator is not meant to constrain any users into a box, and I would actually encourage an open mind and idea generation, as the application of this indicator can take various forms.
> Examples
As you would probably already know, price movement can be fast impulses, and movement can be slow bleeds. In the screenshot below, we are using movements from and to consolidation zones to classify weak trend and strong trend. As you can see, there are also areas of consolidation which get broken out of and confirmed for the larger moves.
Author's Note: In each of these examples, I have outlined the start and end of each session. These examples come from 1 Min Future charts, and have specifically been framed with day trading in mind.
"Breakout Retest" or "Support/Resistance Flips" or "Structure Retests" are all generally the same thing, with different traders referring to them by different names, all of which can be seen throughout these examples.
In the next example, we have a day which started with an early reversal leading into long, slow, trend. Notice how each area throughout the trend essentially moves slightly higher, then consolidates while holding support of the previous zone. This day had a few sharp movements, however there was a large amount of neutrality throughout this day with continuous higher lows.
In contrast to the previous example, next up, we have a very choppy day. Throughout which we see a significant amount of retests before fast directional movements. We also see a few examples of places where previous zones remained relevant into the future. While the zones only display into the resulting trend area, they do not become immediately meaningless once they stop drawing.
> Abstract
In the screenshot below, I have stacked 2 of these indicators, using the high as the source for one and the low as the source for the other. I've hidden lines of the high and low channels to create a 4 lined channel based on the wicks of price.
This is not necessary to use the indicator, but should help provide an idea of creative ways the simple indicator could be used to produce more complicated analysis.
If you've made it this far, I would hope it's clear to you how this indicator could provide value to your trading.
Thank you to DonovonWall for the inspiration.
Enjoy!

Choppiness ZONE OverlayPurpose
This script overlays choppiness zones directly onto the price chart to help traders identify whether the market is trending or ranging. It is designed to filter out low-probability trades during high choppiness conditions.
How It Works
Calculates the Choppiness Index over a user-defined period using ATR and price range.
Divides choppiness into four zones:
30 to 40: Low choppiness, possible trend initiation, shown in yellow.
40 to 50: Moderate choppiness, transition zone, shown in orange.
50 to 60: High choppiness, weakening momentum, shown in red.
60 and above: Extreme choppiness, avoid trading, shown in purple.
Highlights each zone with customizable color fills between the high and low of the selected range.
Triggers a real-time alert when choppiness exceeds 60.
Features
Customizable choppiness zones and color settings.
Real-time alert when market becomes extremely choppy (choppiness ≥ 60).
Visual zone overlay on the price chart.
Compatible with all timeframes.
Lightweight and responsive for scalping, intraday, or swing trading.
Tip
Use this tool as a volatility or trend filter. Combine it with momentum or trend-following indicators to improve trade selection.
