PROTECTED SOURCE SCRIPT
RSI Multi-Timeframe K2
Indicator Name: RSI Multi-Timeframe Cross Indicator
Overview:
"RSI Multi-Timeframe Cross Indicator" is a versatile Pine Script (v5) tool developed for TradingView, designed for traders using multi-time frame analysis. It monitors the Relative Strength Index (RSI) cross its Simple Moving Average (SMA) on multiple time frames (1-minute, 5-minute, 15-minute, 30-minute, 1-hour, 4-hour and daily) to identify bullish and bearish conditions. The indicator overlays the signals on the chart and provides a customizable table to visualize the time frame conditions.
Key Features:
RSI Crossover Detection:
Monitors when the RSI crosses above (bullish trend) or below (bearish trend) its SMA on each selected time frame.
Uses constant state tracking to maintain a bullish/bearish state until an opposite crossover occurs.
Configurable Parameters:
RSI Length: Configurable period for calculating RSI (default: 14).
MA Length: Configurable period for SMA applied to RSI (default: 20).
Time Frame Controls:
Logical Switches: Independent switches ( use1m , use5m , etc.) to include/exclude each time frame in the signal logic.
Visualization Switches: Separate switches ( show1m , show5m , etc.) to show/hide each time frame in the table without affecting the logic.
Visuals:
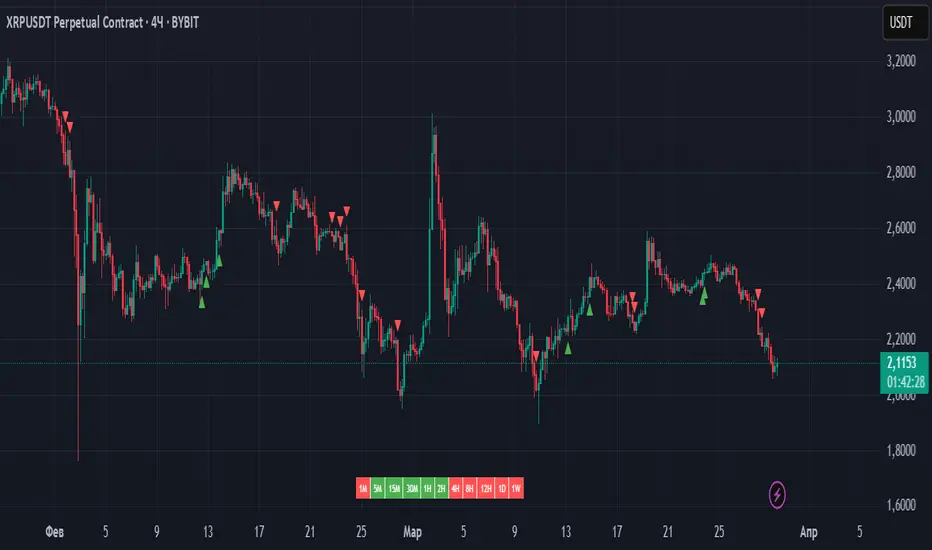
Triangles: Green ascending triangles below the bars indicate bullish signals, red descending triangles above the bars indicate bearish signals.
Labels : Long (green) or Short (red) labels on the last confirmed bar when all enabled timeframes match.
Dynamic Table : A centered table at the bottom of the chart displaying the status of each timeframe with colored boxes (green for bullish, red for bearish). The table size is adjustable based on the visible timeframes.
Alerts :
Trigger alerts when all enabled timeframes are bullish ("All RSI timeframes are bullish (green)!") or bearish ("All RSI timeframes are bearish (red)!").
Input Parameters:
RSI Settings :
RSI Length : Integer (min: 1, default: 14) — Period for RSI calculation.
MA Length : Integer (min: 1, default: 20) — Period for SMA RSI.
Timeframe Logic Settings:
Use 1M in Logic, Use 5M in Logic, etc.: Boolean (default: true) - Enable/Disable each timeframe in signal calculation.
Timeframe Visualization Settings:
Show 1M in Table, Show 5M in Table, etc.: Boolean (default: true) - Show/Hide each timeframe in the table display.
Logic:
Bullish Condition: RSI crosses above SMA on a given timeframe, setting a bullish condition until a bearish crossover occurs.
Bearish Condition: RSI crosses below SMA on a given timeframe, setting a bearish condition until a bullish crossover occurs.
Combination signal: A Long or Short signal is generated only when all enabled timeframes (use the * switches) line up in the same direction (bullish or bearish).
Visualization: The table displays the status of each timeframe, but only shows the fields for the timeframes with the Show* switch enabled.
Visual output:
Chart signals:
A green ascending triangle and a Long label when all enabled timeframes are bullish.
A red downward-pointing triangle and a Short label when all enabled timeframes are bearish.
Table:
Located in the lower center of the chart.
The bars dynamically adjust to the number of visible timeframes (1 to 7).
Each cell displays the time frame name (e.g. "1M", "5M") with a background color indicating its status (green for bullish, red for bearish).
Use:
Trend Confirmation: Used to confirm trends across multiple time frames based on RSI behavior.
Configure: Customize RSI and MA lengths to suit your trading strategy, and turn time frames on/off for both logic and visualization to focus on the relevant periods.
Alerts: Set up alerts to be notified when all selected time frames match, useful for automated trading systems or manual monitoring.
Notes:
The indicator does not display RSI or SMA lines directly on the chart, focusing instead on crossover events and signals.
If all visualization toggles are disabled, the table disappears, but signals and alerts continue to function based on the logic toggles.
Compatible with any chart timeframe, data from later timeframes is retrieved using request.security() .
Overview:
"RSI Multi-Timeframe Cross Indicator" is a versatile Pine Script (v5) tool developed for TradingView, designed for traders using multi-time frame analysis. It monitors the Relative Strength Index (RSI) cross its Simple Moving Average (SMA) on multiple time frames (1-minute, 5-minute, 15-minute, 30-minute, 1-hour, 4-hour and daily) to identify bullish and bearish conditions. The indicator overlays the signals on the chart and provides a customizable table to visualize the time frame conditions.
Key Features:
RSI Crossover Detection:
Monitors when the RSI crosses above (bullish trend) or below (bearish trend) its SMA on each selected time frame.
Uses constant state tracking to maintain a bullish/bearish state until an opposite crossover occurs.
Configurable Parameters:
RSI Length: Configurable period for calculating RSI (default: 14).
MA Length: Configurable period for SMA applied to RSI (default: 20).
Time Frame Controls:
Logical Switches: Independent switches ( use1m , use5m , etc.) to include/exclude each time frame in the signal logic.
Visualization Switches: Separate switches ( show1m , show5m , etc.) to show/hide each time frame in the table without affecting the logic.
Visuals:
Triangles: Green ascending triangles below the bars indicate bullish signals, red descending triangles above the bars indicate bearish signals.
Labels : Long (green) or Short (red) labels on the last confirmed bar when all enabled timeframes match.
Dynamic Table : A centered table at the bottom of the chart displaying the status of each timeframe with colored boxes (green for bullish, red for bearish). The table size is adjustable based on the visible timeframes.
Alerts :
Trigger alerts when all enabled timeframes are bullish ("All RSI timeframes are bullish (green)!") or bearish ("All RSI timeframes are bearish (red)!").
Input Parameters:
RSI Settings :
RSI Length : Integer (min: 1, default: 14) — Period for RSI calculation.
MA Length : Integer (min: 1, default: 20) — Period for SMA RSI.
Timeframe Logic Settings:
Use 1M in Logic, Use 5M in Logic, etc.: Boolean (default: true) - Enable/Disable each timeframe in signal calculation.
Timeframe Visualization Settings:
Show 1M in Table, Show 5M in Table, etc.: Boolean (default: true) - Show/Hide each timeframe in the table display.
Logic:
Bullish Condition: RSI crosses above SMA on a given timeframe, setting a bullish condition until a bearish crossover occurs.
Bearish Condition: RSI crosses below SMA on a given timeframe, setting a bearish condition until a bullish crossover occurs.
Combination signal: A Long or Short signal is generated only when all enabled timeframes (use the * switches) line up in the same direction (bullish or bearish).
Visualization: The table displays the status of each timeframe, but only shows the fields for the timeframes with the Show* switch enabled.
Visual output:
Chart signals:
A green ascending triangle and a Long label when all enabled timeframes are bullish.
A red downward-pointing triangle and a Short label when all enabled timeframes are bearish.
Table:
Located in the lower center of the chart.
The bars dynamically adjust to the number of visible timeframes (1 to 7).
Each cell displays the time frame name (e.g. "1M", "5M") with a background color indicating its status (green for bullish, red for bearish).
Use:
Trend Confirmation: Used to confirm trends across multiple time frames based on RSI behavior.
Configure: Customize RSI and MA lengths to suit your trading strategy, and turn time frames on/off for both logic and visualization to focus on the relevant periods.
Alerts: Set up alerts to be notified when all selected time frames match, useful for automated trading systems or manual monitoring.
Notes:
The indicator does not display RSI or SMA lines directly on the chart, focusing instead on crossover events and signals.
If all visualization toggles are disabled, the table disappears, but signals and alerts continue to function based on the logic toggles.
Compatible with any chart timeframe, data from later timeframes is retrieved using request.security() .
Script protetto
Questo script è pubblicato come codice protetto. Tuttavia, è possibile utilizzarle liberamente e senza alcuna limitazione – ulteriori informazioni qui.
Declinazione di responsabilità
Le informazioni e le pubblicazioni non sono intese come, e non costituiscono, consulenza o raccomandazioni finanziarie, di investimento, di trading o di altro tipo fornite o approvate da TradingView. Per ulteriori informazioni, consultare i Termini di utilizzo.