OPEN-SOURCE SCRIPT
DMI Modified
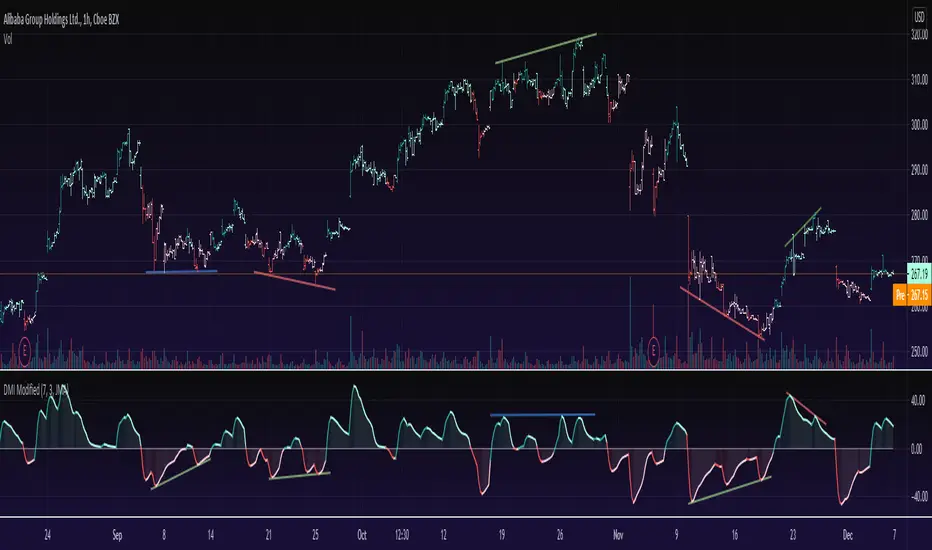
This is a Directional Movement Index (DMI) with a twist, instead of plotting the positive direction of +DI and negative direction for -DI, we subtract the +DI with the -DI on scales of 100 to -100.
The result is plotted with a oscillator to identify the current trend.
DMI Modified supports multiple moving averages (default is JMA with length of 3). You can disable moving averages smoothing in settings.
== About the indicator ==
The Directional Movement Index, or DMI, is an indicator developed by J. Welles Wilder in 1978 that identifies in which direction the price of an asset is moving.
The indicator does this by comparing prior highs and lows and drawing two lines: a positive directional movement line (+DI) and a negative directional movement line (-DI)
In our case we do not draw the two lines, but the result of the subtraction of the two.
== Oscillator Colors ==
GREEN : Asset is above zero line with a strong up trend.
LIGHT GREEN: Asset is above zero line but up trending might be weakening.
RED : Asset is below zero line with a strong downtrend.
LIGHT RED: Asset is below zero line but down trending might be weakening.
== Notes ==
Can also be used to find divergences.
Bar coloring is disabled by default
Like if you like and Enjoy!
There is an idea to make a new strategy combined with DMI Modified (this script) and another script, hench, Follow.
Script open-source
Nello spirito di TradingView, l'autore di questo script lo ha reso open source, in modo che i trader possano esaminarne e verificarne la funzionalità. Complimenti all'autore! Sebbene sia possibile utilizzarlo gratuitamente, ricordiamo che la ripubblicazione del codice è soggetta al nostro Regolamento.
Appreciation of my work: paypal.me/dman103
All Premium indicators: algo.win
LIVE Stream - Pivot Points Algo: youtube.com/channel/UCFyqab-i0xb2jf-c18ufH0A/live
All Premium indicators: algo.win
LIVE Stream - Pivot Points Algo: youtube.com/channel/UCFyqab-i0xb2jf-c18ufH0A/live
Declinazione di responsabilità
Le informazioni e le pubblicazioni non sono intese come, e non costituiscono, consulenza o raccomandazioni finanziarie, di investimento, di trading o di altro tipo fornite o approvate da TradingView. Per ulteriori informazioni, consultare i Termini di utilizzo.