OPEN-SOURCE SCRIPT
Aggiornato Purple Cloud
The above lines calculate several intermediate values used in the indicator's calculations. Here's a breakdown of each variable:
a1: Represents a modified Exponential Moving Average (EMA) of the high price series, subtracted by a Simple Moving Average (SMA) of the low price series.
a2: Takes the square root of the lowest value between the highest close price over the last 200 bars and the current close price, multiplied by a1.
b1: Represents a modified EMA of the low price series, subtracted by an SMA of the high price series.
b2: Takes the square root of the highest value between the lowest close price over the last 200 bars and the current close price, multiplied by b1.
c1: Represents the square root of a2 multiplied by b2.
These lines create multiple plots using the plot function. Each plot represents a displaced version of c1 by a certain multiple of the Average True Range (ATR) multiplied by a constant factor (0.1, 0.2, 0.3, etc.). The transparency (transp) is set to 100 for all plots.
Note di rilascio
Add Alpha Note di rilascio
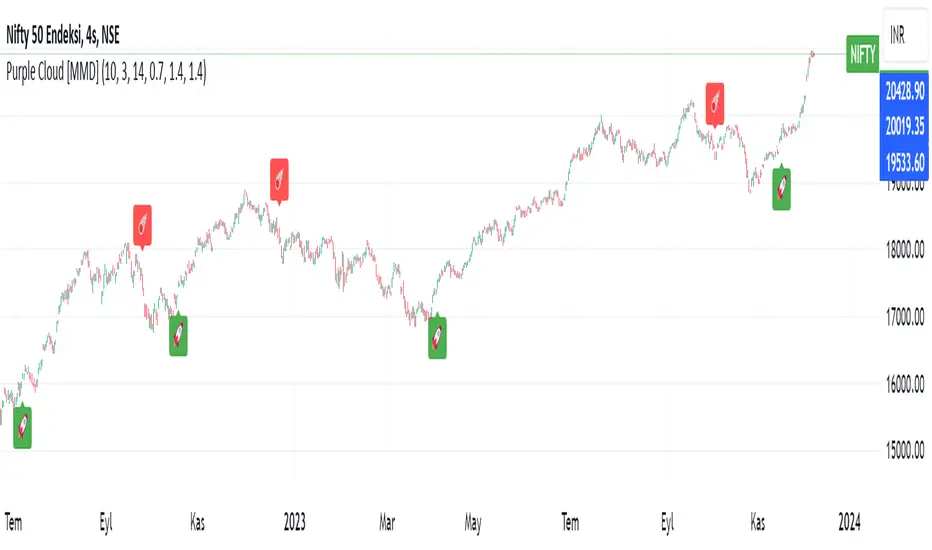
Added Pink Green Yellow bar.Green Bar--->Buy
Pink Bar--->Sell
Yellow Bar--->Unstable
Note di rilascio
I added Maybe Pump Maybe DumpNote di rilascio
Added Rsi Background ColorNote di rilascio
Deleted CloudsNote di rilascio
Added Bomb Pump DumpNote di rilascio
Changed AllNote di rilascio
Change NameNote di rilascio
added alert and funcsNote di rilascio
Added colourNote di rilascio
Added MMD BandsNote di rilascio
Added Supertrend and Ema 200 50 20Note di rilascio
Added Buying Pressure Threshold % and Selling Pressure Threshold % and changed formulaScript open-source
Nello spirito di TradingView, l'autore di questo script lo ha reso open source, in modo che i trader possano esaminarne e verificarne la funzionalità. Complimenti all'autore! Sebbene sia possibile utilizzarlo gratuitamente, ricordiamo che la ripubblicazione del codice è soggetta al nostro Regolamento.
Declinazione di responsabilità
Le informazioni e le pubblicazioni non sono intese come, e non costituiscono, consulenza o raccomandazioni finanziarie, di investimento, di trading o di altro tipo fornite o approvate da TradingView. Per ulteriori informazioni, consultare i Termini di utilizzo.
Script open-source
Nello spirito di TradingView, l'autore di questo script lo ha reso open source, in modo che i trader possano esaminarne e verificarne la funzionalità. Complimenti all'autore! Sebbene sia possibile utilizzarlo gratuitamente, ricordiamo che la ripubblicazione del codice è soggetta al nostro Regolamento.
Declinazione di responsabilità
Le informazioni e le pubblicazioni non sono intese come, e non costituiscono, consulenza o raccomandazioni finanziarie, di investimento, di trading o di altro tipo fornite o approvate da TradingView. Per ulteriori informazioni, consultare i Termini di utilizzo.