OPEN-SOURCE SCRIPT
Aggiornato Open-Close Absolute Difference with Threshold Counts
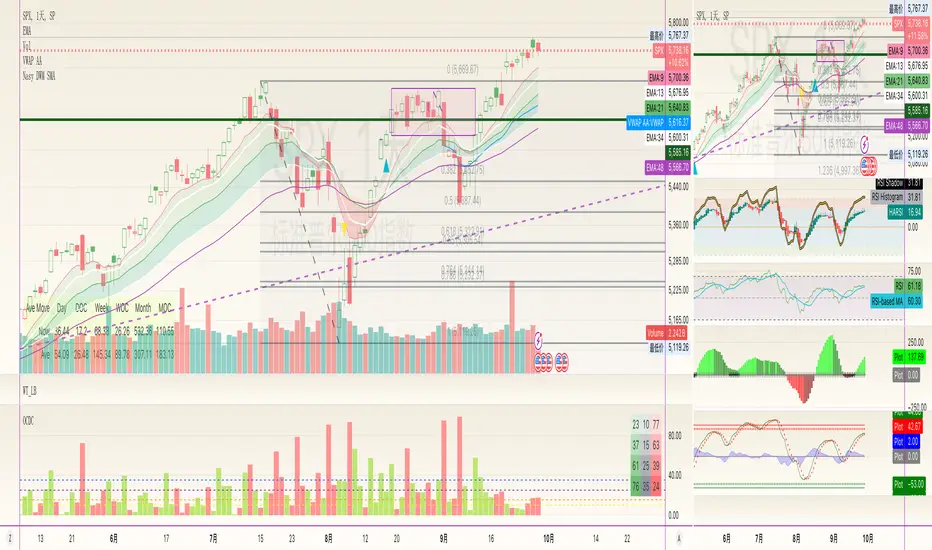
The Open-Close Absolute Difference with Threshold Counts indicator is a versatile tool designed to help traders analyze the volatility and price movements within any given timeframe on their charts. This indicator calculates the absolute difference between the open and close prices for each bar, providing a clear visualization through a color-coded histogram.
Key features include:
• Timeframe Flexibility: Utilizes the current chart’s timeframe, whether it’s a 5-minute, hourly, or daily chart.
• Custom Thresholds: Allows you to set up to four custom threshold levels (Thresholds A, B, C, and D) with default values of 10, 15, 25, and 35, respectively.
• Period Customization: Enables you to define the number of bars (N) over which the indicator calculates the counts, with a default of 100 bars.
• Visual Threshold Lines: Plots horizontal dashed lines on the histogram representing each threshold for easy visual reference.
• Dynamic Counting: Counts and displays the number of times the absolute difference is less than or greater than each threshold within the specified period.
• Customizable Table Position: Offers the flexibility to position the results table anywhere on the chart (e.g., Top Right, Bottom Left).
How It Works:
1. Absolute Difference Calculation:
• For each bar on the chart, the indicator calculates the absolute difference between the open and close prices.
• This difference is plotted as a histogram:
• Green Bars: Close price is higher than the open price.
• Red Bars: Close price is lower than the open price.
2. Threshold Comparison and Counting:
• Compares the absolute difference to each of the four thresholds.
• Determines whether the difference is less than or greater than each threshold.
• Utilizes the ta.sum() function to count occurrences over the specified number of bars (N).
3. Results Table:
• Displays a table with three columns:
• Left Column: Counts where the absolute difference is less than the threshold.
• Middle Column: The threshold value.
• Right Column: Counts where the absolute difference is greater than the threshold.
• The table updates dynamically and can be positioned anywhere on the chart according to your preference.
4. Threshold Lines on Histogram:
• Plots horizontal dashed lines at each threshold level.
• Each line is color-coded for distinction:
• Threshold A: Yellow
• Threshold B: Orange
• Threshold C: Purple
• Threshold D: Blue
How to Use:
1. Add the Indicator to Your Chart:
• Open the Pine Editor on TradingView.
• Copy and paste the provided code into the editor.
• Click “Add to Chart.”
2. Configure Settings:
• Number of Bars (N):
• Set the period over which you want to calculate the counts (default is 100).
• Thresholds A, B, C, D:
• Input your desired threshold values (defaults are 10, 15, 25, 35).
• Table Position:
• Choose where you want the results table to appear on the chart:
• Options include “Top Left,” “Top Center,” “Top Right,” “Bottom Left,” “Bottom Center,” “Bottom Right.”
3. Interpret the Histogram:
• Observe the absolute differences plotted as a histogram.
• Use the color-coded bars to quickly assess whether the close price was higher or lower than the open price.
4. Analyze the Counts Table:
• Review the counts of occurrences where the absolute difference was less than or greater than each threshold.
• Use this data to gauge volatility and price movement intensity over the specified period.
5. Visual Reference with Threshold Lines:
• Refer to the horizontal dashed lines on the histogram to see how the absolute differences align with your thresholds.
Example Use Case:
Suppose you’re analyzing a 5-minute chart for a particular stock and want to understand its short-term volatility:
• Set the Number of Bars (N) to 50 to analyze the recent 50 bars.
• Adjust Thresholds based on the typical price movements of the stock, e.g., Threshold A: 0.5, Threshold B: 1.0, Threshold C: 1.5, Threshold D: 2.0.
• Position the Table at the “Top Right” for easy viewing.
By doing so, you can:
• Quickly see how often the stock experiences significant price movements within 5-minute intervals.
• Make informed decisions about entry and exit points based on the volatility patterns.
• Customize the thresholds and periods as market conditions change.
Benefits:
• Customizable Analysis: Tailor the indicator to fit various trading styles and timeframes.
• Quick Visualization: Instantly assess market volatility and price movement direction.
• Enhanced Decision-Making: Use the counts and visual cues to make more informed trading decisions.
• User-Friendly Interface: Simple configuration and clear display of information.
Note: Always test the indicator with different settings to find the configuration that best suits your trading strategy. This indicator should be used as part of a comprehensive analysis and not as the sole basis for trading decisions.
Note di rilascio
1. Add header for tables.2. Update defaults.
3. Add counts for bull
Script open-source
Nello spirito di TradingView, l'autore di questo script lo ha reso open source, in modo che i trader possano esaminarne e verificarne la funzionalità. Complimenti all'autore! Sebbene sia possibile utilizzarlo gratuitamente, ricordiamo che la ripubblicazione del codice è soggetta al nostro Regolamento.
Declinazione di responsabilità
Le informazioni e le pubblicazioni non sono intese come, e non costituiscono, consulenza o raccomandazioni finanziarie, di investimento, di trading o di altro tipo fornite o approvate da TradingView. Per ulteriori informazioni, consultare i Termini di utilizzo.