OPEN-SOURCE SCRIPT
Aggiornato Fractal Circles
#### FRACTAL CIRCLES ####
I combined 2 of my best indicators Fractal Waves (Simplified) and Circles.
Combining the Fractal and Gann levels makes for a very simple trading strategy.
Core Functionality
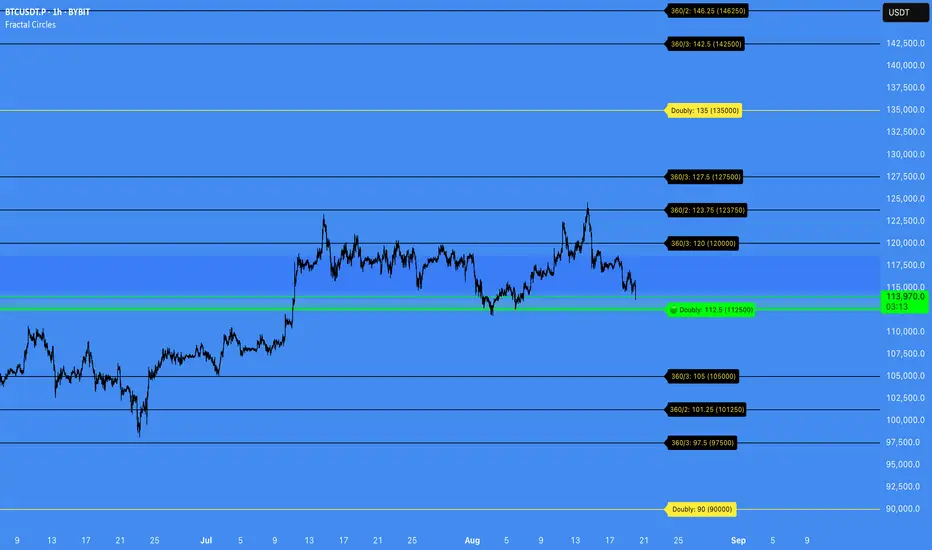
Gann Circle Levels: This indicator plots mathematical support and resistance levels based on Gann theory, including 360/2, 360/3, and doubly strong levels. The system automatically adjusts to any price range using an intelligent multiplier system, making it suitable for forex, stocks, crypto, or any market.
Fractal Wave Analysis: Integrates real-time trend analysis from both current and higher timeframes. Shows the current price range boundaries (high/low) and trend direction through dynamic lines and background fills, helping traders understand market structure.
Key Trading Benefits
Active Level Detection: The closest Gann level to current price is automatically highlighted in green with increased line thickness. This eliminates guesswork about which level is most likely to act as immediate support or resistance.
Real-Time Price Tracking: A customizable line follows current price with an offset to the right, projecting where price sits relative to upcoming levels. A gradient-filled box visualizes the exact distance between current price and the active Gann level.
Multi-Timeframe Context: View fractal waves from higher timeframes while maintaining current timeframe precision. This helps identify whether short-term moves align with or contradict longer-term structure.
Smart Alert System: Comprehensive alerts trigger when price crosses any Gann level, with options to monitor all levels or focus only on the active level. Reduces the need for constant chart monitoring while ensuring you never miss significant level breaks.
Practical Trading Applications
Entry Timing: Use active level highlighting to identify the most probable support/resistance for entries. The real-time distance box helps gauge risk/reward before entering positions.
Risk Management: Set stops based on Gann level breaks, particularly doubly strong levels which tend to be more significant. The gradient visualization makes it easy to see how much room price has before hitting key levels.
Trend Confirmation: Fractal waves provide immediate context about whether current price action aligns with broader market structure. Bullish/bearish background fills offer quick visual confirmation of trend direction.
Multi-Asset Analysis: The auto-scaling multiplier system works across all markets and timeframes, making it valuable for traders who monitor multiple instruments with vastly different price ranges.
Confluence Trading: Combine Gann levels with fractal wave boundaries to identify high-probability setups where multiple technical factors align.
This tool is particularly valuable for traders who appreciate mathematical precision in their technical analysis while maintaining the flexibility to adapt to real-time market conditions.
I combined 2 of my best indicators Fractal Waves (Simplified) and Circles.
Combining the Fractal and Gann levels makes for a very simple trading strategy.
Core Functionality
Gann Circle Levels: This indicator plots mathematical support and resistance levels based on Gann theory, including 360/2, 360/3, and doubly strong levels. The system automatically adjusts to any price range using an intelligent multiplier system, making it suitable for forex, stocks, crypto, or any market.
Fractal Wave Analysis: Integrates real-time trend analysis from both current and higher timeframes. Shows the current price range boundaries (high/low) and trend direction through dynamic lines and background fills, helping traders understand market structure.
Key Trading Benefits
Active Level Detection: The closest Gann level to current price is automatically highlighted in green with increased line thickness. This eliminates guesswork about which level is most likely to act as immediate support or resistance.
Real-Time Price Tracking: A customizable line follows current price with an offset to the right, projecting where price sits relative to upcoming levels. A gradient-filled box visualizes the exact distance between current price and the active Gann level.
Multi-Timeframe Context: View fractal waves from higher timeframes while maintaining current timeframe precision. This helps identify whether short-term moves align with or contradict longer-term structure.
Smart Alert System: Comprehensive alerts trigger when price crosses any Gann level, with options to monitor all levels or focus only on the active level. Reduces the need for constant chart monitoring while ensuring you never miss significant level breaks.
Practical Trading Applications
Entry Timing: Use active level highlighting to identify the most probable support/resistance for entries. The real-time distance box helps gauge risk/reward before entering positions.
Risk Management: Set stops based on Gann level breaks, particularly doubly strong levels which tend to be more significant. The gradient visualization makes it easy to see how much room price has before hitting key levels.
Trend Confirmation: Fractal waves provide immediate context about whether current price action aligns with broader market structure. Bullish/bearish background fills offer quick visual confirmation of trend direction.
Multi-Asset Analysis: The auto-scaling multiplier system works across all markets and timeframes, making it valuable for traders who monitor multiple instruments with vastly different price ranges.
Confluence Trading: Combine Gann levels with fractal wave boundaries to identify high-probability setups where multiple technical factors align.
This tool is particularly valuable for traders who appreciate mathematical precision in their technical analysis while maintaining the flexibility to adapt to real-time market conditions.
Note di rilascio
Gradient needed to be inverted, but was not working. Fixed. Note di rilascio
Bug fix. Price level now extends both for a clear view of where price is in relation to the active circle line. The active circle line is always the one that is closest to price. Note di rilascio
I have added a "Mirror" line that reflects the real time price on the opposite side of the active circle level. This plays into an idea of price "orbiting" a circle level and the velocities seem to be fairly consistent. Script open-source
Nello spirito di TradingView, l'autore di questo script lo ha reso open source, in modo che i trader possano esaminarne e verificarne la funzionalità. Complimenti all'autore! Sebbene sia possibile utilizzarlo gratuitamente, ricordiamo che la ripubblicazione del codice è soggetta al nostro Regolamento.
Declinazione di responsabilità
Le informazioni e le pubblicazioni non sono intese come, e non costituiscono, consulenza o raccomandazioni finanziarie, di investimento, di trading o di altro tipo fornite o approvate da TradingView. Per ulteriori informazioni, consultare i Termini di utilizzo.
Script open-source
Nello spirito di TradingView, l'autore di questo script lo ha reso open source, in modo che i trader possano esaminarne e verificarne la funzionalità. Complimenti all'autore! Sebbene sia possibile utilizzarlo gratuitamente, ricordiamo che la ripubblicazione del codice è soggetta al nostro Regolamento.
Declinazione di responsabilità
Le informazioni e le pubblicazioni non sono intese come, e non costituiscono, consulenza o raccomandazioni finanziarie, di investimento, di trading o di altro tipo fornite o approvate da TradingView. Per ulteriori informazioni, consultare i Termini di utilizzo.