OPEN-SOURCE SCRIPT
Dollar Volume + SD [ZTD]
### So, What's the Big Deal with SD Dollar Volume?
TL:DR
What you see:
1. $ Volume = (Price * Volume) / 1M (we divide it by 1M by default so you don't have to look at 12 digits but you can select between 100k/1M/10M)
2. User selected M.A. period with difference sources
3. Up to 4 Standard Deviation from that M.A.
4. Color coded (explained below)
That's it, no fancy useless multi color rainbows. Functional, bringing depth and clarity to your analysis based on reality not optical illusion.
--------------
The Long version
You know how we've always looked at volume? It's a classic, but it's got a blind spot. A million shares traded when a stock is at $10 is a completely different ballgame from a million shares traded when it's at $200. The first is $10M in action; the second is $200M. Traditional volume treats them the same, but they are not the same story.
That's the whole idea behind the **Dollar Volume Standard Deviation (SD $VVOLUME)** indicator. Instead of just counting shares, it tracks the **actual dollar amount** ( also refered as Dollar Volume) changing hands. This gives you a much clearer picture of the real financial power behind a price move. It helps you see when the "big money" is truly stepping in or backing off.
Think about it this way: after a 20% drop on earnings, you might see a 10% volume increase and think, "Wow, buyers are stepping in!" But if you look at the *value traded*, it might actually be lower than the day before because the share price is so much cheaper. This indicator cuts through that noise.
What about that smaller stock you bought that suddenly doubles in prices in a matter of months. Do you really thing the volume you are looking at carries any meaning anymore?
On longer time frame? Think about Volume traded vs Value Traded on NVDA for example. Looking at volume alone on those charts is absolutely meaningless. I even wonder why volume alone ever existed in the first place as an indicator.
### How to Use It in Your Trading
This isn't just theory; here’s how you can actually use it to make better decisions.
#### Reading the Indicator
The indicator is designed to be visual and intuitive. Here’s what you're looking at:
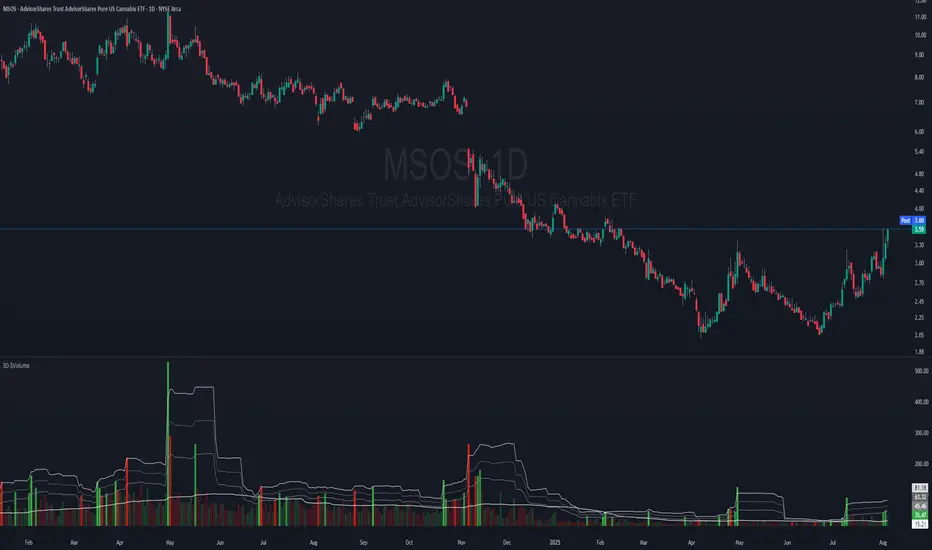
* **The Bars:** Each bar on the indicator represents the total dollar value traded during that period. Bigger bar, more money moved.
* **The White Line:** This is your baseline—the moving average of the value traded. It shows you the normal level of money flow for that stock.
* **Bar Colors (The Important Part):**
* **Direction:** **Green** means the stock closed higher in that period. **Red** means it closed lower. Simple enough.
* **Intensity:** This is the real magic. The brightness or intensity of the color tells you how significant that money flow was. A dull, faded bar means the value traded was pretty average. A **bright, intense bar** means the value was way above normal (usually 1 or 2 standard deviations away from the average). *That's* when you need to pay attention.
#### Actionable Signals for Your Strategy
* **Spotting High-Conviction Moves:** When you see a bright, intense red or green bar that towers over the others, that's a signal of major conviction. Big players are making a decisive move, either buying up everything in sight or dumping their positions. This is your cue that something significant is happening.
* **Confirming a Trend's Strength:** Are you in a strong uptrend? Look for a consistent pattern of bright green bars. This tells you that significant capital is flowing in to support the rising price. It's confirmation that the trend has legs.
* **Catching a Weakening Trend (Divergence):** This is a powerful one. Imagine the stock price is grinding out new highs, but on the SD
V
VOLUME
indicator, the bars are getting smaller and less intense. That's a major red flag. It shows that even though the price is inching up, the real money isn't following. There's no conviction, and the trend could be about to reverse.
* **Gauging Liquidity:** If the bars are consistently low and dull, it's a sign that interest in the stock is drying up. It's a good way to spot illiquid conditions and avoid getting trapped in a stock that's hard to get out of.
Ultimately, SD VVOLUME helps you see the market from a different angle. It's not just about the noise of shares being traded; it's about following the money.
TL:DR
What you see:
1. $ Volume = (Price * Volume) / 1M (we divide it by 1M by default so you don't have to look at 12 digits but you can select between 100k/1M/10M)
2. User selected M.A. period with difference sources
3. Up to 4 Standard Deviation from that M.A.
4. Color coded (explained below)
That's it, no fancy useless multi color rainbows. Functional, bringing depth and clarity to your analysis based on reality not optical illusion.
--------------
The Long version
You know how we've always looked at volume? It's a classic, but it's got a blind spot. A million shares traded when a stock is at $10 is a completely different ballgame from a million shares traded when it's at $200. The first is $10M in action; the second is $200M. Traditional volume treats them the same, but they are not the same story.
That's the whole idea behind the **Dollar Volume Standard Deviation (SD $VVOLUME)** indicator. Instead of just counting shares, it tracks the **actual dollar amount** ( also refered as Dollar Volume) changing hands. This gives you a much clearer picture of the real financial power behind a price move. It helps you see when the "big money" is truly stepping in or backing off.
Think about it this way: after a 20% drop on earnings, you might see a 10% volume increase and think, "Wow, buyers are stepping in!" But if you look at the *value traded*, it might actually be lower than the day before because the share price is so much cheaper. This indicator cuts through that noise.
What about that smaller stock you bought that suddenly doubles in prices in a matter of months. Do you really thing the volume you are looking at carries any meaning anymore?
On longer time frame? Think about Volume traded vs Value Traded on NVDA for example. Looking at volume alone on those charts is absolutely meaningless. I even wonder why volume alone ever existed in the first place as an indicator.
### How to Use It in Your Trading
This isn't just theory; here’s how you can actually use it to make better decisions.
#### Reading the Indicator
The indicator is designed to be visual and intuitive. Here’s what you're looking at:
* **The Bars:** Each bar on the indicator represents the total dollar value traded during that period. Bigger bar, more money moved.
* **The White Line:** This is your baseline—the moving average of the value traded. It shows you the normal level of money flow for that stock.
* **Bar Colors (The Important Part):**
* **Direction:** **Green** means the stock closed higher in that period. **Red** means it closed lower. Simple enough.
* **Intensity:** This is the real magic. The brightness or intensity of the color tells you how significant that money flow was. A dull, faded bar means the value traded was pretty average. A **bright, intense bar** means the value was way above normal (usually 1 or 2 standard deviations away from the average). *That's* when you need to pay attention.
#### Actionable Signals for Your Strategy
* **Spotting High-Conviction Moves:** When you see a bright, intense red or green bar that towers over the others, that's a signal of major conviction. Big players are making a decisive move, either buying up everything in sight or dumping their positions. This is your cue that something significant is happening.
* **Confirming a Trend's Strength:** Are you in a strong uptrend? Look for a consistent pattern of bright green bars. This tells you that significant capital is flowing in to support the rising price. It's confirmation that the trend has legs.
* **Catching a Weakening Trend (Divergence):** This is a powerful one. Imagine the stock price is grinding out new highs, but on the SD
V
VOLUME
indicator, the bars are getting smaller and less intense. That's a major red flag. It shows that even though the price is inching up, the real money isn't following. There's no conviction, and the trend could be about to reverse.
* **Gauging Liquidity:** If the bars are consistently low and dull, it's a sign that interest in the stock is drying up. It's a good way to spot illiquid conditions and avoid getting trapped in a stock that's hard to get out of.
Ultimately, SD VVOLUME helps you see the market from a different angle. It's not just about the noise of shares being traded; it's about following the money.
Script open-source
Nello spirito di TradingView, l'autore di questo script lo ha reso open source, in modo che i trader possano esaminarne e verificarne la funzionalità. Complimenti all'autore! Sebbene sia possibile utilizzarlo gratuitamente, ricordiamo che la ripubblicazione del codice è soggetta al nostro Regolamento.
Declinazione di responsabilità
Le informazioni e le pubblicazioni non sono intese come, e non costituiscono, consulenza o raccomandazioni finanziarie, di investimento, di trading o di altro tipo fornite o approvate da TradingView. Per ulteriori informazioni, consultare i Termini di utilizzo.