RSI5 Multi Time Frame Indicator
Date of Creation: 12/13/2016
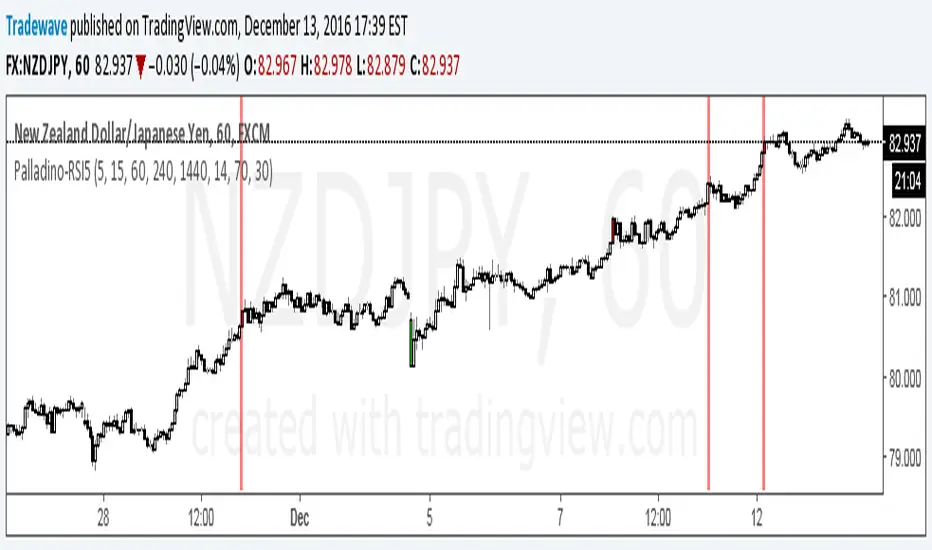
Checks overbought or oversold conditions across 5 time frames.
If Time frame 1, 2 and 3 are all overbought then bar color changes to red
If Time frame 1, 2 and 3 are all oversold then bar color changes to green
If Time frame 1, 2, 3, 4 and 5 are all overbought then a vertical red line is added to the plot
If Time frame 1, 2, 3, 4 and 5 are all oversold then a vertical green line is added to the plot
The user has the ability to change:
1) Any of the 5 time frames (Set in minutes: m5 = 5, m15 = 15, h1 = 60, h4 = 240, D = 1440...)
2) RSI overbought threshold Level
3) RSI oversold threshold Level
4) RSI Period
Script su invito
Solo gli utenti approvati dall'autore possono accedere a questo script. È necessario richiedere e ottenere l'autorizzazione per utilizzarlo. Tale autorizzazione viene solitamente concessa dopo il pagamento. Per ulteriori dettagli, seguire le istruzioni dell'autore riportate di seguito o contattare direttamente LiquidityTracker.
TradingView NON consiglia di acquistare o utilizzare uno script a meno che non si abbia piena fiducia nel suo autore e se ne comprenda il funzionamento. È inoltre possibile trovare alternative gratuite e open source nei nostri script della community.
Istruzioni dell'autore
Declinazione di responsabilità
Script su invito
Solo gli utenti approvati dall'autore possono accedere a questo script. È necessario richiedere e ottenere l'autorizzazione per utilizzarlo. Tale autorizzazione viene solitamente concessa dopo il pagamento. Per ulteriori dettagli, seguire le istruzioni dell'autore riportate di seguito o contattare direttamente LiquidityTracker.
TradingView NON consiglia di acquistare o utilizzare uno script a meno che non si abbia piena fiducia nel suo autore e se ne comprenda il funzionamento. È inoltre possibile trovare alternative gratuite e open source nei nostri script della community.