RSI Multi-Timeframe Dashboard by giua64)### Summary
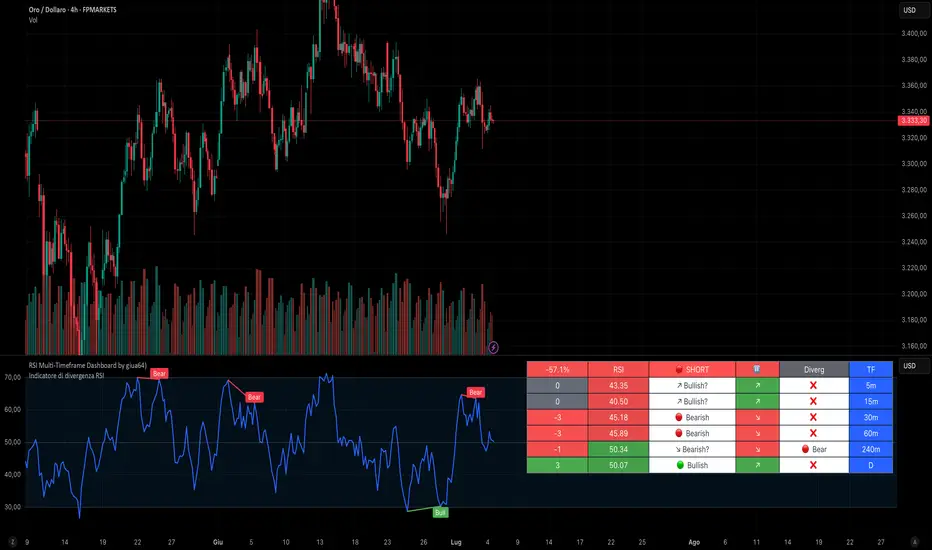
This is an advanced dashboard that provides a comprehensive overview of market strength and momentum, based on the Relative Strength Index (RSI) analyzed across 6 different timeframes simultaneously (from 5 minutes to the daily chart).
The purpose of this script is to offer traders an immediate and easy-to-read summary of market conditions, helping to identify the prevailing trend direction, overbought/oversold levels, and potential reversals through divergence detection. All of this is available in a single panel, eliminating the need to switch timeframes on your main chart.
### Key Features
* **Multi-Timeframe Analysis:** Simultaneously monitors the 5m, 15m, 30m, 1H, 4H, and Daily timeframes.
* **Scoring System:** Each timeframe is assigned a score based on multiple RSI conditions (e.g., above/below 50, overbought/oversold status, direction) to quantify bullish or bearish strength.
* **Aggregated Signal:** The dashboard calculates a total percentage score and provides a clear summary signal: **LONG**, **SHORT**, or **WAIT**.
* **Divergence Detection:** Automatically identifies Bullish and Bearish divergences between price and RSI for each timeframe.
* **Non-Repainting Option:** In the settings, you can choose to base calculations on the close of the previous candle (`Use RSI on Closed Candle`). This ensures that past signals (like status and score) do not change, providing more reliable data for analysis.
* **Fully Customizable:** Users can modify the RSI period, overbought/oversold thresholds, divergence detection settings, and the appearance of the table.
### How to Read the Dashboard
The table consists of 6 columns, each providing specific information:
* **% (Total Score):**
* **Header:** Shows the overall strength as a percentage. A positive value indicates bullish momentum, while a negative value indicates bearish momentum. The background color changes based on intensity.
* **Rows:** Displays the numerical score for the individual timeframe.
* **RSI:**
* **Header:** The background color indicates the average of all RSI values. Green if the average is > 50, Red if < 50.
* **Rows:** Shows the real-time RSI value for that timeframe.
* **Signal (Status):**
* **Header:** This is the final operational signal. It turns **🟢 LONG** when bullish strength is high, **🔴 SHORT** when bearish strength is high, and **⚪ WAIT** in neutral conditions.
* **Rows:** Describes the RSI status for that timeframe (e.g., Bullish, Bearish, Overbought, Oversold).
* **Dir (Direction):**
* **Header:** Displays an arrow representing the majority direction across all timeframes.
* **Rows:** Shows the instantaneous direction of the RSI (↗️ for rising, ↘️ for falling).
* **Diverg (Divergence):**
* Indicates if a bullish (`🟢 Bull`) or bearish (`🔴 Bear`) divergence has been detected on that timeframe.
* **TF (Timeframe):**
* Indicates the reference timeframe for that row.
### Advantages and Practical Use
This tool was created to solve a common problem: the need to analyze multiple charts to understand the bigger picture. With this dashboard, you can:
1. **Confirm a Trend:** A predominance of green and a "LONG" signal provides strong confirmation of bullish sentiment.
2. **Identify Weakness:** Red signals on higher timeframes can warn of an impending loss of momentum.
3. **Spot Turning Points:** A divergence on a major timeframe can signal an excellent reversal opportunity.
### Originality and Acknowledgements
This script is an original work, written from scratch by giua64. The idea was to create a comprehensive and visually intuitive tool for RSI analysis.
Any feedback, comments, or suggestions to improve the script are welcome!
**Disclaimer:** This is a technical analysis tool and should not be considered financial advice. Always do your own research and backtest any tool before using it in a live trading environment.
Script open-source
In pieno spirito TradingView, il creatore di questo script lo ha reso open-source, in modo che i trader possano esaminarlo e verificarne la funzionalità. Complimenti all'autore! Sebbene sia possibile utilizzarlo gratuitamente, ricorda che la ripubblicazione del codice è soggetta al nostro Regolamento.
giua64
borsamercati.it – Educational tools by giua64
Anche su:
Declinazione di responsabilità
Le informazioni ed i contenuti pubblicati non costituiscono in alcun modo una sollecitazione ad investire o ad operare nei mercati finanziari. Non sono inoltre fornite o supportate da TradingView. Maggiori dettagli nelle Condizioni d'uso.
Relative Strength Index (RSI)
Relative Strength Suite [BLC]📊 Relative Strength Suite
A powerful, all-in-one relative strength toolkit for traders and analysts. Whether you're a trend follower, momentum trader, or sector rotator, this script gives you the flexibility to analyze and screen assets using three distinct RS methodologies—all in one clean interface.
🔍 What It Does
Flexible Relative Strength allows you to compare any asset to a benchmark (like SP:SPX , NASDAQ:QQQ , AMEX:IWM , etc.) using one of four modes:
📈 Relative Strength – Classic price ratio comparison
📘 Dorsey Relative Strength – Smoothed trend-based RS using EMA
📒 Mansfield Relative Strength – Momentum-based RS normalized to its own average
🧮 Screener Mode – Load Indicator into Pine Screener to see all 3 values.
🛠️ Key Features & Settings
🧩 Relative Strength
Comparison Symbol: Select the ticker you want to use as a benchmark.
Highlights new highs/lows in Relative Strength with dynamic line coloring:
🟢 Green = New high (outperformance)
🔴 Red = New low (underperformance)
Optional moving average overlay (SMA, EMA, WMA, HMA) for trend smoothing.
✅ Use Case: Identify when a stock is gaining strength relative to the market or sector.
📘 2. Dorsey RS (Smoothed Trend)
Uses an EMA of the RS ratio to smooth out noise.
Rising Dorsey RS = consistent outperformance.
Falling Dorsey RS = consistent underperformance.
✅ Use Case: Spot long-term relative trends regardless of price volatility.
📒 3. Mansfield RS (Performance Momentum)
Compares RS ratio to its own long-term SMA (default 200).
Values above 0 = outperforming the benchmark.
Values below 0 = underperforming.
✅ Use Case: Ideal for momentum traders and Stan Weinstein-style stage analysis.
🧮 4. Screener Mode
Not for use on your chart. This is only to use in TradingView's Pine Screener.
Displays all three RS lines simultaneously.
Includes all 3 modes to act as screener signals
🛠️How to Use Screener Mode
Add this indicator to your favorites list.
Open Pine Screener and select this indicator.
Select your timeframe.
Click Settings & Change Strength Type to Screener > Click Apply
Hit Scan!
New High Low Signal: Finds stocks making a new RS high (1) or low (-1) over your lookback period.
Dorsey Trend Signal: Finds stocks where the smoothed RS trend is rising (1) or falling (-1).
Mansfield Zone Signal: Finds stocks where momentum is in the positive zone (1) or negative zone (-1)
✅ Use Case: Quickly scan multiple assets for relative strength breakouts, trend shifts, or momentum zones.
🧪 Pro Tip
Combine this indicator with volume, price structure, or moving averages to confirm breakouts and trend strength. Use Screener Mode on a watchlist to identify top RS candidates in seconds.
To clean up your screener table, click the column settings icon ( ⋮ ) and uncheck any columns you don't need to see. You can still filter by them even if they are hidden.
📝 Credits & Notes
Inspired by classic RS methods (including Dorsey and Mansfield).
Final, production-ready version with tooltips, labels, and screener outputs.
For educational and informational purposes—always test before live trading!
Let me know if you see any bugs, miscalculations, or any features you'd like to see added to it!

Range Breakout [sgbpulse]Range Breakout
1. Overview
The "Range Breakout " indicator is a powerful tool designed to identify and visually display price ranges on your chart using pivot points. It dynamically draws two distinct boxes – an External Range and an Internal Range – helping traders pinpoint potential support and resistance zones. Beyond its visual representation, the indicator offers a comprehensive set of 12 unique breakout alerts, providing real-time notifications for significant price movements outside these defined ranges. Additionally, it integrates RSI and MFI metrics for momentum confirmation.
2. How It Works
The indicator operates by identifying pivot points based on user-defined "left" and "right" bar lengths. A high pivot is a bar with a specified number of lower highs both to its left and right, and similarly for a low pivot.
External Range: Calculated using longer pivot lengths (default: 15 bars left, 6 bars right). This range represents broader, more significant price consolidation areas.
Internal Range: Calculated using shorter pivot lengths (default: 4 bars left, 3 bars right). This range captures tighter, more immediate price consolidations within the broader trend.
The External Range will always be greater than or equal to the Internal Range, as it's based on a wider historical context. Both ranges are displayed as transparent boxes on your chart, dynamically adjusting as new pivots are formed.
3. Key Features and Settings
Customizable Pivot Lengths:
External Range (Left/Right Bars): Adjust sensitivity for identifying the broader price range. Longer lengths lead to more stable, but less frequent, range updates.
Internal Range (Left/Right Bars): Adjust sensitivity for the tighter, more immediate price range.
Tool Tips: Minimum 6 bars for the External Range, and minimum 2 bars for the Internal Range.
Customizable Range Colors: Easily change the background colors of the External and Internal Range boxes to match your chart's aesthetic.
Dynamic Range Display: The indicator automatically updates the range boxes as new pivot highs and lows are formed, always presenting the most current valid ranges.
RSI / MFI Settings:
Timeframe Source: Select the timeframe for RSI and MFI calculation.
- Chart: Calculation based on the current chart timeframe.
- Daily: Always calculated based on the daily ("D") timeframe, even if the chart is on a lower timeframe.
RSI Length: Period length for RSI calculation (default: 14).
RSI Overbought Level: Overbought level for RSI (default: 70.0).
RSI Oversold Level: Oversold level for RSI (default: 30.0).
MFI Length: Period length for MFI calculation (default: 14).
MFI Overbought Level: Overbought level for MFI (default: 80.0).
MFI Oversold Level: Oversold level for MFI (default: 20.0).
4. Synergy of Ranges & Breakout Strength
The interaction between the External and Internal Ranges provides deep insights into price movement and breakout strength:
Immediate Direction: The movement of the Internal Range (up or down) indicates the short-term directional bias within the broader framework of the External Range.
Strength Confirmation: A breakout of the External Range, followed by a breakout of the Internal Range, confirms the strength of the move and increases confidence in the breakout.
Strong Momentum ("Leaving" Ranges Behind): When price breaks out with exceptionally strong momentum, it continues to move aggressively and does not immediately form new pivots. In such situations, the existing ranges (External and Internal) remain in place while the candles "leave them behind." A "Full Candle" breakout, where the entire candle moves past both ranges, indicates a particularly powerful and decisive move.
Momentum (RSI / MFI) as Confirmation:
- RSI (Relative Strength Index): Measures the speed and change of price movements. Extreme values (above 70 or below 30) indicate overbought/oversold conditions respectively, confirming strong momentum in a breakout.
- MFI (Money Flow Index): Similar to RSI but incorporates volume. Extreme values (above 80 or below 20) indicate strong money flow in/out, reinforcing breakout confirmation.
- Importance of Confirmation: If a breakout occurs but momentum indicators do not confirm it (for example, an upside breakout while RSI is declining), this could signal weakness in the move and the risk of a false breakout (Fakeout).
5. Visuals
The indicator provides clear visual representations on the chart:
Range Boxes:
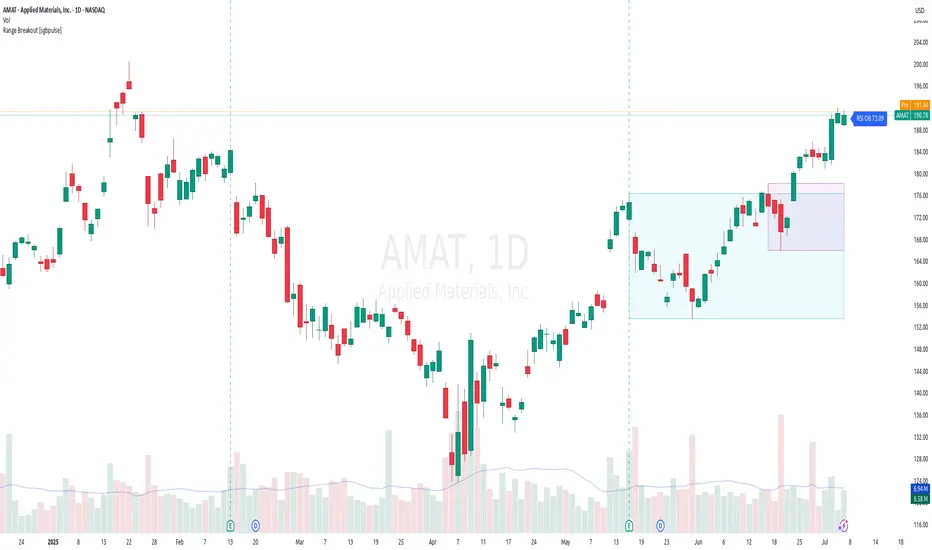
Two dynamic boxes are drawn on the chart: one for the External Range and one for the Internal Range.
These boxes update continuously, displaying the current range boundaries based on the latest pivots. They provide an immediate visual indication of support and resistance levels.
RSI/MFI Status Labels:
Small text labels appear to the right of the current bar, vertically centered.
They display the status of RSI and MFI: RSI OB (Overbought), RSI OS (Oversold), MFI OB, MFI OS, along with the exact value.
Important: The labels remain on the chart as long as the condition holds (indicator is above/below the level), unlike alerts which mark a singular crossover event.
Plotting of Key Values:
The indicator plots six invisible series on the chart, primarily to allow the user to view the exact numerical values of:
- The upper and lower bounds of the External Range (External High, External Low).
- The upper and lower bounds of the Internal Range (Internal High, Internal Low).
- The calculated RSI and MFI values (RSI, MFI).
These values are accessible for viewing through TradingView's Data Window and also via the Status Line when hovering over the relevant candle. This enables more precise quantitative analysis of range levels and momentum.
6. Comprehensive Breakout Alerts
The "Range Breakout " indicator provides 12 distinct alert conditions for breakouts, allowing you to select the required level of confirmation for each alert. All alerts are triggered only upon a fully confirmed bar close (barstate.isconfirmed) to minimize false signals and ensure reliability.
All breakout alerts are configured to detect a Crossover/Crossunder of the levels, meaning a specific event where the price moves from one side of the range to the other.
External Range Breakout UP
- Close: Price closes above the External Range.
- Real Body: The entire "real body" of the candle (min of open/close prices) closes above the External Range.
- Full Candle: The entire candle (the lowest point of the candle) closes above the External Range.
External Range Breakout DOWN
- Close: Price closes below the External Range.
- Real Body: The entire "real body" of the candle (max of open/close prices) closes below the External Range.
- Full Candle: The entire candle (the highest point of the candle) closes below the External Range.
Internal Range Breakout UP
- Close: Price closes above the Internal Range.
- Real Body: The "real body" of the candle closes above the Internal Range.
- Full Candle: The entire candle closes above the Internal Range.
Internal Range Breakout DOWN
- Close: Price closes below the Internal Range.
- Real Body: The "real body" of the candle closes below the Internal Range.
- Full Candle: The entire candle closes below the Internal Range.
7. Ideal Use Cases
This indicator is ideal for traders who:
Want to clearly identify and monitor price consolidation zones.
Seek confirmation for breakout strategies across various timeframes.
Require reliable and automated alerts for potential entry or exit points based on range expansion.
8. Complementary Indicator
For even more comprehensive market analysis, we highly recommend using this indicator in conjunction with Market Structure Support & Resistance External/Internal & BoS .
This powerful complementary indicator automatically and accurately identifies significant support and resistance levels by locating high and low pivot points, as well as key Pre-Market High/Low levels. Its strength lies in its dynamic adaptability to any timeframe and asset, providing precise and relevant real-time levels while maintaining a clean chart. It also identifies Break of Structure (BoS) to signal potential trend changes or continuations.
Using both indicators together provides a robust framework for identifying defined ranges and potential trend shifts, enabling more informed trading decisions.
View Market Structure Support & Resistance External/Internal & BoS Indicator
9. Important Note: Trading Risk
This indicator is intended for educational and informational purposes only and does not constitute investment advice or a recommendation for trading in any form whatsoever.
Trading in financial markets involves significant risk of capital loss. It is important to remember that past performance is not indicative of future results. All trading decisions are your sole responsibility. Never trade with money you cannot afford to lose.
Crypto Narratives: Relative Strength V2Simple Indicator that displays the relative strength of 8 Key narratives against BTC as "Spaghetti" chart. The chart plots an aggregated RSI value for the 5 highest Market Cap cryopto's within each relevant narrative. The chart plots a 14 period SMA RSI for each narrative.
Functionality:
The indicator calculates the average RSI values for the current leading tokens associated with ten different crypto narratives:
- AI (Artificial Intelligence)
- DeFi (Decentralized Finance)
- Memes
- Gaming
- Level 1 (Layer 1 Protocols)
- AI Agents
- Storage/DePin
- RWA (Real-World Assets)
- BTC
Usage Notes:
The 5 crypto coins should be regularly checked and updated (in the script) by overtyping the current values from Rows 24 - 92 to ensure that you are using the up to date list of highest marketcap coins (or coins of your choosing).
The 14 period SMA can be changed in the indicator settings.
The indicator resets every 24 hours and is set to UTC+10. This can be changed by editing the script line 19 and changing the value of "resetHour = 1" to whatever value works for your timezone.
There is also a Rate of Change table that details the % rate of change of each narrative against BTC
Horizontal lines have been included to provide an indication of overbought and oversold levels.
The upper and lower horizontal line (overbought and oversold) can be adjusted through the settings.
The line width, and label offset can be customised through the input options.
Alerts can be set to triggered when a narrative's RSI crosses above the overbought level or below the oversold level. The alerts include the narrative name, RSI value, and the RSI level.

Low Price RSI CrossoverThis Pine Script indicator is a Multi-Timeframe Low RSI Crossover system that combines three key filtering criteria to identify high-probability buy signals. Here's what it does:
Core Concept
The indicator only generates buy signals when all three conditions are met simultaneously:
Price at Multi-Period Low: Current price must be at or near the lowest point within your selected timeframe (1 week to 5 years, or custom)
RSI Momentum Shift: The smoothed RSI must cross above its signal line (EMA), indicating upward momentum
Below Threshold Entry: Both the RSI and its signal line must be below your threshold level (default 50) when the crossover occurs
Key Features
RSI Smoothing: Uses Hull Moving Average (HMA) to smooth the raw RSI, reducing noise and false signals while maintaining responsiveness.
Flexible Timeframes: Choose from predefined periods (1W, 2W, 3W, 1M, 2M, 3M, 6M, 9M, 1Y, 2Y, 3Y, 5Y) or set a custom number of bars.
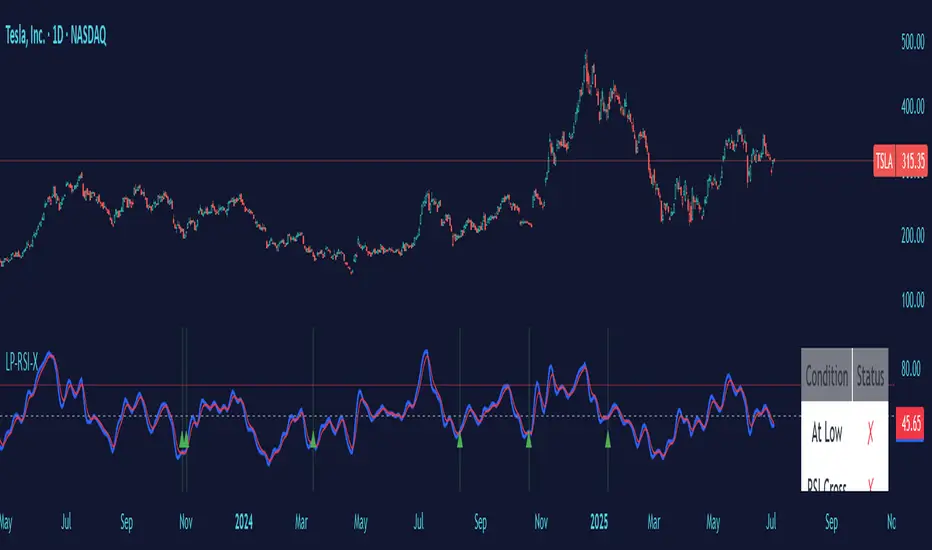
Visual Feedback:
Plots the smoothed RSI (blue line) and its signal line (red line)
Shows threshold and overbought levels
Highlights signal bars with green background
Displays tiny green triangles at signal points
Real-time status table showing all conditions
Trading Logic
This is essentially a mean-reversion strategy that waits for:
Price to reach significant lows (value zone)
Momentum to start shifting upward (RSI crossover)
Entry from oversold/neutral territory (below 50 RSI)
Why This Works
By requiring price to be at multi-period lows, you avoid buying during downtrends or sideways chop. The RSI crossover confirms that selling pressure is starting to ease, while the threshold filter ensures you're not buying into overbought conditions.
The combination of these filters should significantly reduce false signals compared to using any single indicator alone.
Gabriel's Relative Strength IndexGabriel’s RSI—The Reinvention of Relative Strength
Not your average RSI.
This is a fully reengineered Relative Strength Index that merges the power of advanced signal processing, adaptive smoothing, volume dynamics, and intelligent divergence detection into a single, modular toolkit designed for precision trading across all markets.
Whether you’re scalping crypto, swing trading equities, or dissecting futures contracts—Gabriel’s RSI adapts to your strategy with unrivaled control and clarity.
1. RSI Settings
RSI Length (Jurik): Set to 51 by default to mimic a 21-period standard RSI when Jurik smoothing is applied. Adjust lower (e.g., 22) to mimic a 9-period RSI.
RSI Source: The default is hlc3 for smoother RSI inputs. Can be changed to any price-based series (close, open, etc.) for customization.
2. RSI Smoothing Options
MA Type: Smoothing applies to both RSI and its MA overlay simultaneously. I used to use the 56 EMA RSI, and it works well too.
JMA: Best for adaptive recursive smoothing. A power of 2 and a phase of 50 are used.
T3: Smooth and lag-reduced, suitable for trend detection. The alpha is 0.7.
SMA + Bollinger Bands: Adds deviation-based envelopes for volatility spotting.
MA Length: Affects how smooth or reactive the RSI signal is.
BB StdDev: Only relevant if BBs are used. Controls bandwidth for overbought/oversold zones.
3. MACD Settings
Fast/Slow Length: Defaults (21/81) optimized for smoother MACD with SMA or T3. For Algo trading, EMA/JMA is best.
Signal Length: Shorter (e.g., 2) gives more reactive crossover signals, it can be increased.
Source: Default is close. Close works best for the settings I input.
MA Types: JMA and EMA reduce noise and increase signal generation. Select SMA for simplicity or T3 for trend-following.
Histogram: Bar colors signal strength and trend of MACD directly on your chart.
4. Directional Movement Index (DMI)
ADX Smoothing: High values (e.g., 100) offer strong trend confirmation with Hann Window smoothing.
DI Length: Affects DI+/- sensitivity. 100 ADX - 12 DI or 15 ADX - 35 DI are suggested, the latter for quicker boot time, as 100 bars is quite long.
Smoothing Type: Choose Hann Window for refined smoothing; RMA (SMMA) for simplicity.
Volatility Type: ATR includes gaps; ADR is useful for gapless strategies.
Plotted as area fills, 0 to 100 scaled.
5. Volume Z-Score
%R Length: Normalizes volume to percentile range (73 swing, 112 exhaustion).
Z-Score Lengths: Compares short-term and long-term volume trends with Z-scores of volume.
Fast Z-Score < Slow Z-Score = Gives a Volume Squeeze.
Fast MA > Slow MA = Bullish Volume Divergence; volume has been fired. Not via Z-score, but instead via SMA, ALMA, and RMA of volume.
WPR Volume: Weighted %R used to highlight exhaustion/pivot points.
Plot volume bars after a volume squeeze has been fired; if bars aren't plotted, then it's under squeeze. Backtest on ES1! Prove it's good for catching bottoms below 15 minutes as well.
6. Divergence Engine
Pivot Settings: Pivot Period (12), Divergence minval Lookback (5), and max Lookback Bars (100) control sensitivity. Works well on any asset class; these are the optimal settings for the RSI.
Source Options: RSI, MACD, ADX, DI difference, or Volume %R.
Divergence Type:
Regular: Classic reversal signals.
Hidden: Continuation signals.
Heikin Ashi Mode: Enables use of HA candles on normal charts for smoother pivots. May distort values if your chart is H.A. so leave it unchecked then.
7. Squeeze Momentum (SQZMOM)
Squeeze Types:
Wide (Black): Regular compression
Normal (Red), Regular Squeeze
Narrow (Yellow), Golden Squeeze
Very Narrow (Purple) Extreme compression
Fired (Green): Breakout detected
Plotted as circles on the bottom of my indicator.
Momentum Bar Colors:
Cyan: Rising momentum
Blue: Pullback within uptrend
Red: Falling momentum
Yellow: Correction within downtrend
Reversal Lines: Dashed lines indicate momentum crossing its Jurik MA (DM-Style Pivots).
Plotted as squares on the top of my indicator.
8. Rate of Change (RoC)
RoC of Momentum: EMA-smoothed RoC on momentum for leading signals. Double smoothed, once and then another time for smoother signals.
Signal Line: JMA used to filter noise and generate reversal signals.
Crossovers: Bullish/bearish signals based on RoC vs signal line are plotted as triangles directly on your chart.
Optimized: Backtested for short-term setups like 1H or faster. Works on Daily timeframes as well for Futures.
9. Multi-Timeframe Squeeze Settings
Each timeframe (Hourly, 4H, Daily, Weekly, Monthly) has:
Reversal Toggle: Enables dashed line DM-Style Pivots on crossovers.
MA Length: For Jurik MA smoothing on momentum.
BB/KC Thresholds: Define squeeze sensitivity per timeframe. A shorter BB/KC length, 17-14-12, responds better on lower timeframes.
Momentum Length: Tailors oscillator responsiveness; 20 is ideal.
10. BB Std. Deviation Scaling
Low-Pass Super Smoother : Smooths (True Range) noise for BBs.
High-Pass Butterworth : Extracts cycles for BB Stdv. blend.
Root Mean Squared : Dynamic BB width adjustment based on market activity.
11. Alerts
RSI: Overbought/oversold reversals. Several types.
MACD: Histogram shift through zero line.
DMI/ADX: Crossovers and strength conditions. The 17 key level is used for the ADX.
Volume: Smart Money alerts on low-volume zones. May concentrate on ICT sessions.
Squeeze: Alerts on all 5 squeeze states.
Momentum: Crosses and reversals.
RoC: Bullish and bearish crosses.
Divergences: Regular, hidden, combined.
12. Visual Output Summary
RSI Line + MA/BBs
MACD Histogram Bar Colors
DMI/ADX as area fills
Volume %R columns
Squeeze Momentum Shapes and Dots
RoC Crossover Arrows
DM-style Breakout Pivots
Divergence Lines and Labels
Best Practices
Watch the slope of the RSI for pullbacks on a strong trend. Combine it with squeeze for exit timing.
Combine RSI Divergence with MACD histogram cross and Squeeze firing for precise entry.
Use Volume Z-Score to filter for institutional activity, and enter Long. Watch for reversals as well.
Watch RoC crossovers for fast, leading signals.
Enable Reversal Lines on 1H+ charts for breakout or breakdown pivots.
Use multi-timeframe thresholds for swing confirmation. The TFs I use the most are 2-5-15 minutes for futures and swinging with 1 hour daily and weekly. Those are the TFs I backtested.

Price x Vol RSIAn enhanced RSI indicator that integrates the RSI of volume as a conviction amplifier.
This script modifies the RSI to range from −1 to +1, allowing it to express directional momentum. Volume RSI remains in the range of 0 to +1, serving as a direction-neutral amplifier.
The result is a bi-directional composite RSI that:
>> Emphasizes congruent signals (e.g., strong price direction with strong volume).
>> Minimizes misleading signals from high volume paired with neutral or conflicting price movement.
Ideal for identifying high-conviction breakouts and momentum divergences with volume support.
the plot fill increases in color when the plot approaches zero, then reverses away from zero, and resets on a zero-cross.
check out my other script, the PXVS, which is what this RSI script was based on. it uses similar logic as this script, but with FSTO %K instead of RSI

Divergence Screener [Trendoscope®]🎲Overview
The Divergence Screener is a powerful TradingView indicator designed to detect and visualize bullish and bearish divergences, including hidden divergences, between price action and a user-selected oscillator. Built with flexibility in mind, it allows traders to customize the oscillator type, trend detection method, and other parameters to suit various trading strategies. The indicator is non-overlay, displaying divergence signals directly on the oscillator plot, with visual cues such as lines and labels on the chart for easy identification.
This indicator is ideal for traders seeking to identify potential reversal or continuation signals based on price-oscillator divergences. It supports multiple oscillators, trend detection methods, and alert configurations, making it versatile for different markets and timeframes.
🎲Features
🎯Customizable Oscillator Selection
Built-in Oscillators : Choose from a variety of oscillators including RSI, CCI, CMO, COG, MFI, ROC, Stochastic, and WPR.
External Oscillator Support : Users can input an external oscillator source, allowing integration with custom or third-party indicators.
Configurable Length : Adjust the oscillator’s period (e.g., 14 for RSI) to fine-tune sensitivity.
🎯Divergence Detection
The screener identifies four types of divergences:
Bullish Divergence : Price forms a lower low, but the oscillator forms a higher low, signaling potential upward reversal.
Bearish Divergence : Price forms a higher high, but the oscillator forms a lower high, indicating potential downward reversal.
Bullish Hidden Divergence : Price forms a higher low, but the oscillator forms a lower low, suggesting trend continuation in an uptrend.
Bearish Hidden Divergence : Price forms a lower high, but the oscillator forms a higher high, suggesting trend continuation in a downtrend.
🎯Flexible Trend Detection
The indicator offers three methods to determine the trend context for divergence detection:
Zigzag : Uses zigzag pivots to identify trends based on higher highs (HH), higher lows (HL), lower highs (LH), and lower lows (LL).
MA Difference : Calculates the trend based on the difference in a moving average (e.g., SMA, EMA) between divergence pivots.
External Trend Signal : Allows users to input an external trend signal (positive for uptrend, negative for downtrend) for custom trend analysis.
🎯Zigzag-Based Pivot Analysis
Customizable Zigzag Length : Adjust the zigzag length (default: 13) to control the sensitivity of pivot detection.
Repaint Option : Choose whether divergence lines repaint based on the latest data or wait for confirmed pivots, balancing responsiveness and reliability.
🎯Visual and Alert Features
Divergence Visualization : Divergence lines are drawn between price pivots and oscillator pivots, color-coded for easy identification:
Bullish Divergence : Green
Bearish Divergence : Red
Bullish Hidden Divergence : Lime
Bearish Hidden Divergence : Orange
Labels and Tooltips : Labels (e.g., “D” for divergence, “H” for hidden) appear on price and oscillator pivots, with tooltips providing detailed information such as price/oscillator values, ratios, and pivot directions.
Alerts : Configurable alerts for each divergence type (bullish, bearish, bullish hidden, bearish hidden) trigger on bar close, ensuring timely notifications.
🎲 How It Works
🎯Oscillator Calculation
The indicator calculates the selected oscillator (or uses an external source) and plots it on the chart.
Oscillator values are stored in a map for reference during divergence calculations.
🎯Pivot Detection
A zigzag algorithm identifies pivots in the oscillator data, with configurable length and repainting options.
Price and oscillator pivots are compared to detect divergences based on their direction and ratio.
🎯Divergence Identification
The indicator compares price and oscillator pivot directions (HH, HL, LH, LL) to identify divergences.
Trend context is determined using the selected method (Zigzag, MA Difference, or External).
Divergences are classified as bullish, bearish, bullish hidden, or bearish hidden based on price-oscillator relationships and trend direction.
🎯Visualization and Alerts
Valid divergences are drawn as lines connecting price and oscillator pivots, with corresponding labels.
Alerts are triggered for allowed divergence types, providing detailed information via tooltips.
🎯Validation
Divergence lines are validated to ensure no intermediate bars violate the divergence condition, enhancing signal reliability.
🎲 Usage Instructions as Indicator
🎯Add to Chart:
Add the “Divergence Screener ” to your TradingView chart.
The indicator appears in a separate pane below the price chart, plotting the oscillator and divergence signals.
🎯Configure Settings:
Adjust the oscillator type and length to match your trading style.
Select a trend detection method and configure related parameters (e.g., MA type/length or external signal).
Set the zigzag length and repainting preference.
Enable/disable alerts for specific divergence types.
I🎯nterpret Signals:
Bullish Divergence (Green) : Look for potential buy opportunities in a downtrend.
Bearish Divergence (Red) : Consider sell opportunities in an uptrend.
Bullish Hidden Divergence (Lime) : Confirm continuation in an uptrend.
Bearish Hidden Divergence (Orange): Confirm continuation in a downtrend.
Use tooltips on labels to review detailed pivot and divergence information.
🎯Set Alerts:
Create alerts for each divergence type to receive notifications via TradingView’s alert system.
Alerts include detailed text with price, oscillator, and divergence information.
🎲 Example Scenarios as Indicator
🎯 With External Oscillator (Use MACD Histogram as Oscillator)
In order to use MACD as an oscillator for divergence signal instead of the built in options, follow these steps.
Load MACD Indicator from Indicator library
From Indicator settings of Divergence Screener, set Use External Oscillator and select MACD Histograme from the dropdown
You can now see that the oscillator pane shows the data of selected MACD histogram and divergence signals are generated based on the external MACD histogram data.
🎯 With External Trend Signal (Supertrend Ladder ATR)
Now let's demonstrate how to use external direction signals using Supertrend Ladder ATR indicator. Please note that in order to use the indicator as trend source, the indicator should return positive integer for uptrend and negative integer for downtrend. Steps are as follows:
Load the desired trend indicator. In this example, we are using Supertrend Ladder ATR
From the settings of Divergence Screener, select "External" as Trend Detection Method
Select the trend detection plot Direction from the dropdown. You can now see that the divergence signals will rely on the new trend settings rather than the built in options.
🎲 Using the Script with Pine Screener
The primary purpose of the Divergence Screener is to enable traders to scan multiple instruments (e.g., stocks, ETFs, forex pairs) for divergence signals using TradingView’s Pine Screener, facilitating efficient comparison and identification of trading opportunities.
To use the Divergence Screener as a screener, follow these steps:
Add to Favorites : Add the Divergence Screener to your TradingView favorites to make it available in the Pine Screener.
Create a Watchlist : Build a watchlist containing the instruments (e.g., stocks, ETFs, or forex pairs) you want to scan for divergences.
Access Pine Screener : Navigate to the Pine Screener via TradingView’s main menu: Products -> Screeners -> Pine, or directly visit tradingview.com/pine-screener/.
Select Watchlist : Choose the watchlist you created from the Watchlist dropdown in the Pine Screener interface.
Choose Indicator : Select Divergence Screener from the Choose Indicator dropdown.
Configure Settings : Set the desired timeframe (e.g., 1 hour, 1 day) and adjust indicator settings such as oscillator type, zigzag length, or trend detection method as needed.
Select Filter Criteria : Select the condition on which the watchlist items needs to be filtered. Filtering can only be done on the plots defined in the script.
Run Scan : Press the Scan button to display divergence signals across the selected instruments. The screener will show which instruments exhibit bullish, bearish, bullish hidden, or bearish hidden divergences based on the configured settings.
🎲 Limitations and Possible Future Enhancements
Limitations are
Custom input for oscillator and trend detection cannot be used in pine screener.
Pine screener has max 500 bars available.
Repaint option is by default enabled. When in repaint mode expect the early signal but the signals are prone to repaint.
Possible future enhancements
Add more built-in options for oscillators and trend detection methods so that dependency on external indicators is limited
Multi level zigzag support


Divergence IndicatorLook for green circles (bullish divergences) below bars and red circles (bearish divergences) above bars.
Set up alerts as needed using the "Bullish Divergence" or "Bearish Divergence" conditions.

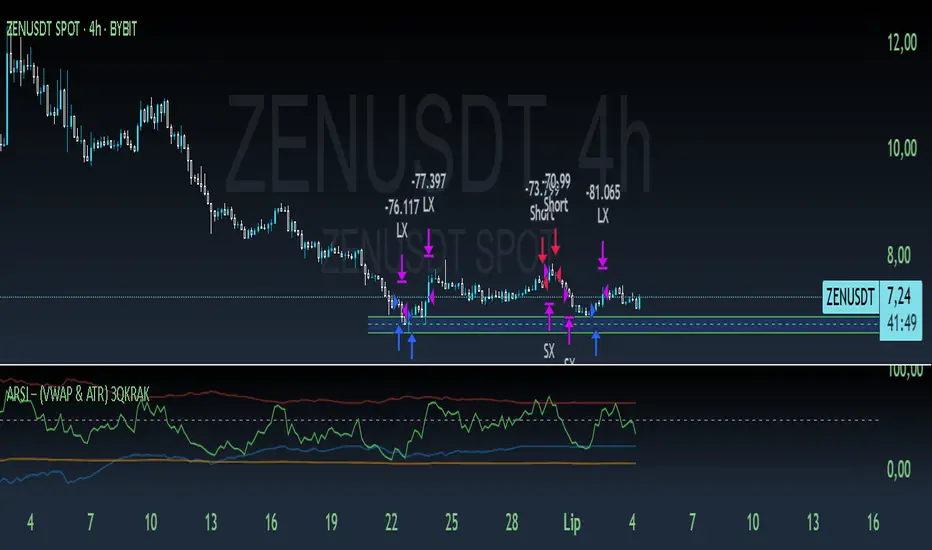
ARSI – (VWAP & ATR) 3QKRAKThe ARSI Long & Short – Dynamic Risk Sizing (VWAP & ATR) indicator combines three core components—an adjusted RSI oscillator (ARSI), Volume‐Weighted Average Price (VWAP), and Average True Range (ATR)—so that entry/exit signals and position sizing are always tailored to current market conditions. ARSI, plotted from 0 to 100 with clearly marked overbought and oversold zones, is the primary signal driver: when ARSI falls below the lower threshold it indicates an excessive sell‐off and flags a long opportunity, whereas a break above the upper threshold signals overextended gains and foreshadows a short. A midpoint line at 50 can serve as an early exit or reduction signal when crossed against your position.
VWAP, showing the volume‐weighted average price over the chosen period, acts as a trend filter—long trades are only taken when price sits above VWAP, and shorts only when it’s below—ensuring each trade aligns with the prevailing market momentum. ATR measures current volatility and is used both to set safe stop‐loss levels and to dynamically size each position. In practice, this means positions automatically shrink in high‐volatility environments and grow in quieter markets, all while risking a fixed percentage of your capital.
Everything appears on a single chart: the ARSI pane below the price window with its reference levels; VWAP overlaid on the price; and the ATR‐based stop‐loss distances graphically displayed. Traders thus get a comprehensive, at-a-glance view of entries, exits, trend confirmation, and exactly how large a position they can safely take. The indicator runs in real time, removing the need for manual parameter calculations and letting you focus on strategic decision-making.
Adiyogi Trend🟢🔴 “Adiyogi” Trend — Market Alignment Visualizer
“Adiyogi” Trend is a powerful, non-intrusive trend detection system built for traders who seek clarity, discipline, and alignment with true market flow. Inspired by the meditative stillness of Adiyogi and the need for mindful, high-probability decisions, this tool offers a clean and intuitive visual guide to trending environments — without cluttering the chart or pushing forced trades.
This is not a buy/sell signal generator. Instead, it is designed as a background confirmation engine that helps you stay on the right side of the market by identifying moments of true directional strength.
🧠 Core Logic
The “Adiyogi” Trend indicator highlights the background of your chart in green or red when multiple layers of strength and structure align — including momentum, market positioning, and relative force. Only when these internal components agree does the system activate a directional state.
It’s built on three foundational energies of trend confirmation:
Strength of movement
Structure in price action
Conviction in momentum
By combining these into one visual background, the indicator filters out indecision and helps you stay focused during real trend phases — whether you're day trading, swing trading, or holding longer-term positions.
📌 Core Concepts Behind the Tool
The indicator integrates three essential market filters—each confirming a different dimension of trend strength:
ADX (Average Directional Index) – Measures trend momentum.
You’ve chosen a very responsive setting (ADX Length = 2), which helps catch the earliest possible signs of momentum emergence.
The threshold is ADX ≥ 22, ensuring that weak or sideways markets are filtered out.
SuperTrend (10,1) – Captures short-term trend direction.
This setup follows price closely and reacts quickly to reversals, making it ideal for fast-moving assets or intraday strategies.
SuperTrend acts as the structural confirmation of directional bias.
RSI (Relative Strength Index) – Measures strength based on recent price closes.
You’ve configured RSI > 50 for bullish zones and < 50 for bearish—a neutral midpoint standard often used by professional traders.
This ensures that only trades in sync with momentum and recent strength are highlighted.
🌈 How It Visually Works
Background turns GREEN when:
ADX ≥ 22, indicating strong momentum
Price is above the 20 EMA and above SuperTrend (10,1)
RSI > 50, confirming recent strength
Background turns RED when:
ADX ≥ 22, indicating strong momentum
Price is below the 20 EMA and below SuperTrend (10,1)
RSI < 50, confirming recent weakness
The background remains neutral (transparent) when trend conditions are not clearly aligned—this is the tool's way of keeping you out of indecisive markets.
A label (BULL / BEAR) appears only when the bias flips from the previous one. This helps avoid repeated or redundant alerts, focusing your attention only when something changes.
📊 Practical Uses & Benefits
✅ Stay with the trend: Perfectly filters out choppy or sideways markets by only activating when conditions align across momentum, structure, and strength.
✅ Pre-trade confirmation: Use this tool to confirm trade setups from other indicators or price action patterns.
✅ Avoid noise: Prevent overtrading by focusing only on high-quality trend conditions.
✅ Visual clarity: Unlike arrows or plots that clutter the chart, this tool subtly highlights trend conditions in the background, preserving your price action view.
📍 Important Notes
This is not a buy/sell signal generator. It is a trend-confirmation system.
Use it in conjunction with your existing entry setups—such as breakouts, order blocks, retests, or candlestick patterns.
The tool helps you stay in sync with the dominant direction, especially when combining multiple timeframes.
Can be used on any market (stocks, forex, crypto, indices) and on any timeframe.

BTCs RSI Dip & EMA Crossover AlertThis indicator helps you catch potential reversal opportunities after a stock or crypto asset becomes oversold.
🛠 How it works:
Watches RSI (Relative Strength Index)
First, it waits for RSI to dip below a level you choose (default is 30), which often signals the asset is oversold and due for a bounce.
Waits for Price Confirmation
After the RSI dip, the indicator watches for the first time price closes above both the 55 EMA and 200 EMA — a strong sign that momentum may be shifting upward.
Sends a “Buy” Signal
When that happens, the script:
Plots a green “Buy” label on the chart
Triggers an alert (labeled "Buy Indicator") so you’re notified immediately
⚙️ Customizable Inputs:
RSI threshold (e.g. 30 or 25)
RSI period (e.g. 14)
EMA lengths (default: 55 and 200)
✅ Designed to:
Avoid false signals by requiring both RSI weakness and price strength
Only trigger once per RSI dip, so you’re not spammed with repeat alerts
Use it to stay patient during downtrends and get alerted when the technicals show a possible turnaround. Great for swing traders and longer-term entries.

BB + RSI & Volume FilterThis script overlays three sets of technical filters on your price chart and generates signals when conditions align:
Bollinger Bands
Calculates upper, middle, and lower bands using either SMA or EMA.
Buy signal when price crosses up through the lower band.
Sell signal when price crosses down through the upper band.
Volume Filter
Computes a simple moving average of volume.
Ensures breakout moves have sufficient volume by requiring current volume > SMA(volume) × multiplier.
RSI Filter
Computes RSI on the chosen source.
Buy when RSI crosses above the oversold threshold.
Sell when RSI crosses below the overbought threshold.
Only plots RSI signals that pass the volume filter.
You get:
Bollinger entry/exit shapes (labeled “BB ↑/↓”).
RSI entry/exit shapes (labeled “RSI”) only when volume confirms the move.
Alerts for each signal type.
This combination reduces false breakouts by requiring both volatility (Bollinger) or momentum (RSI) and volume confirmation

RSI + Divergence + Stochastic RSIsimple indicator combining RSI and STOCH
RSI indicator (with divergence detection, smoothing, and optional Bollinger Bands)
Stochastic RSI indicator (with %K and %D lines, bands, and background fill)

ALIP FX Smart Scalper – Precision for 1-Min TradersALIP FX Smart Scalper – Precision for 1-Min Traders
Looking for a powerful and clean scalping tool built for the 1-minute chart?
This indicator is engineered for serious scalpers who demand high accuracy, zero repaint, and trend-aligned signals.
✅ Key Features:
🔹 Trend-based filtering (EMA logic)
🔹 RSI + ATR + Slope conditions
🔹 No repaint – signals appear only on closed candles
🔹 Buy & Sell alerts with label and audio
🔹 Works best on BTC, NAS100, Gold (1m/5m TF)
💡 Why It Works:
The ALIP FX Smart Scalper ignores weak noise signals and only highlights clean trend-following opportunities.
Perfect for traders who want fast decisions with logic, not luck.
📌 Live test it now on TradingView
🔗
📥 More tools & education: t.me
🔻 Powered by: ALIP FX
"Success Elevated. Trade Smarter."
#ALIPFX #ScalpingIndicator #NoRepaint #TradingTools #SmartScalper #BTCUSD #NASDAQ100 #Gold

Bollinger Band + RSI Strategy ScannerVrushaNilansh Indicator for 15min. Trading Based on Bollinger Bands+RSI

RSI-BBGun-v6.1RSI BB Gun – Operator's Guide
“Eyes on target. Wait for the right moment. Then strike.”
________________________________________
🎯 Mission Objective
RSI BB Gun identifies extreme market conditions using RSI and Bollinger Bands, then overlays trend and volatility intelligence so you know when the setup is real.
The ❌ is your target acquisition signal—price just moved from an extreme zone back into play. Now you’ve got a clean radar lock.
________________________________________
📡 How to Operate
🟣 Step 1: Watch for the ❌'s (Black X = RSI & Bollinger Band Extremes Encountered)
• The Purple X means price and RSI are both stretched—and just snapped back into range.
• The target is now in the cross hairs and potentially ready for engagement.
🟥 Step 2: Confirm the Trend
• The thick ribbon tells you if the trend is with you:
o 🟢 Green = Uptrend. Focus on long setups.
o 🔴 Red = Downtrend. Focus on puts or short plays.
• Align with trend. Only engage when the field favors your position.
🔺 Step 3: Evaluate Signal Context
• Green Triangles = price just crossed below lower Bollinger Band (oversold).
• Red Triangles = price crossed above upper Band (overbought).
• Horizontal Lines Disappeared = The bar after the green or red horizontal line disappears means its time. We patiently wait for this as it means the momentum may be changing.
• These are your early indicators—they scout the setup on the GO / NO GO DECISION.
• ❌ + triangle + trend = clean shot.
________________________________________
☁️ Avoid These Situations
• ❌ in a choppy/no-trend zone = false alarm. Don’t engage.
• Repeated black ❌s without a purple ❌confirmation = low conviction. Let it go.
________________________________________
________________________________________
🪖 Operator's Mindset
“You don’t chase trades. You stalk them. When the ❌ flashes, the system has found a target. What you do next is up to your discipline, your tools, and your plan.”
________________________________________
Note: This is a free version. Upcoming paid version includes multi-timeframes working together. Multiple strategies. Volatility meter. Make money and master the BB Gun so that you can elevate to the Snipers weapon.
🔒 Want More Firepower?
Upgraded version coming soon. Unlocks next-gen targeting tools:
• Multi-timeframe RSI intelligence in a live dashboard
• Precision-timed combo signals based on layered volatility + RSI logic
• Advanced trend filters, trade zone overlays, and sniper-level entry indicators
• Ideal for swing traders and options strategists who want clarity under pressure
💥 Budget-friendly. No subscription. Upgrade when you're ready to go Pro.
Tip: Make 4+ trades mastering this setup. Then use a small portion of the trades to gain more features. Always be in a position you cannot lose.
🆚 Why This Beats Standard RSI/BB Tools
Mission Feature Basic Indicators RSI Ribbon Lite
Trend Confirmation ❌ ✅ Ribbon Overlay
Multi-Timeframe Awareness ❌ ✅ 5-Timeframe RSI Grid
Volatility Confirmation ❌ ✅ Weighted ATR Scoring
Combo Signal Alerts ❌ ✅ ❌ Reentry Combo Alerts
TradingView Alerts ❌ ✅ Built-In Radar Ping
#rsi #bb #bollingerbands #hull ma #trend

Omega Market Mood Meter [OmegaTools]The Omega Market Mood Meter is a precision-built sentiment oscillator that captures the market’s emotional intensity through a multi-layered RSI system. Designed for traders who seek to align with the market's true behavioral state, it blends momentum readings with a brand-new, rarely-seen innovation: the Sentiment-Weighted Moving Average (WMA-Ω)—a trend filter that dynamically adjusts to the market’s psychological tone.
🧠 Market Mood Oscillator
At its core, the Ω 3M oscillator aggregates three RSI-based components:
RSI(9) on close — captures short-term tension;
RSI(21) on HLC3 — balances medium-term positioning;
RSI(50) on HL2 — reflects long-term directional weight.
Each input is scaled and weighted to contribute to a final oscillator centered around zero, with ±50 and ±100 acting as key sentiment boundaries. When values exceed ±100, the market is likely reaching emotional extremes—zones that often precede reversals or require caution.
Visual features include:
Dynamic Background Highlighting: automatically emphasizes extreme sentiment zones.
Reference Lines: plotted at ±100, ±50, and 0 for fast sentiment interpretation.
🔥 WMA-Ω: Sentiment-Weighted Moving Average
The standout innovation of this tool is the Weighted Market Mood Moving Average, or WMA-Ω—a proprietary calculation that averages price using the absolute value of sentiment as its weighting force. This approach gives greater importance to price during periods of strong emotional conviction (either bullish or bearish), resulting in a context-aware trend filter that reacts only when sentiment truly matters.
This technique:
Filters noise during low-volatility or indecisive conditions;
Enhances reliability by reacting to meaningful sentiment surges;
Offers a more psychologically-adjusted trend baseline compared to traditional MAs.
Visually:
When price is above WMA-Ω, a semi-transparent bullish fill highlights underlying strength;
When below, a bearish fill reveals dominant downward sentiment.
This feature is unique among public TradingView tools and provides an edge in identifying trend quality with psychological context.
✅ How to Use
Extreme Sentiment Zones (±100): Use as contrarian warning zones or signal dampeners.
Crosses of WMA-Ω: Treat these as psychological trend confirmations; price above indicates structurally bullish sentiment and vice versa.
Range-bound Bias: Between ±50, sentiment may be indecisive; watch for breakout or alignment with WMA-Ω.
Advanced Confluence: Combine with other Omega tools (e.g., Ω Bias Forecaster, Ω IV Walls) for powerful regime-based strategies.
Omega Market Mood Meter is ideal for discretionary and systematic traders who want a clean, multi-timeframe sentiment readout and a cutting-edge weighted trend engine grounded in market psychology.

RSI StrategyDesigned for Options, this strategy uses the Relative Strength Index (RSI), a bounded‐oscillator (0–100) that compares a series’ average up‐moves with its average down‐moves over the last N bars (14 by default).
RSI < 30 → “oversold.”
RSI > 70 → “over-bought.”

ANDROMEDA - TrendSyncANDROMEDA - TrendSync
Pedro Canto - Portfolio Manager | CGA/CGE
OVERVIEW
Trend Sync is a multi-layered trend-following indicator designed to help traders identify high-probability trend continuation setups while avoiding low-quality entries caused by overbought or oversold market conditions.
This indicator combines the power of Moving Averages (MA), MACD , and a visual RSI-based filter to validate both trend direction and timing for entries. It's goal is simple: filter out noise and highlight only the most technically relevant buy and sell signals based on objective momentum and trend criteria.
---
WALKTHROUGH
This indicator is built for traders seeking to operate in the direction of established trends. It's core principle is to identify and validate current trend conditions, and then signal entry opportunities during pullbacks to key moving averages.
Trend identification is achieved through the alignment of two moving averages. When these MAs are crossed and angled in the same direction, they confirm that a trend is in progress. To double-confirm trend direction, the MACD histogram is used—only. When both the MAs and MACD are aligned in the same direction, then the trend is considered valid.
Once all trend criteria are met, a dynamic coloring system is activated to visually reinforce the trend across the candles and moving averages.
To avoid poor entries during market exhaustion, an RSI-based filter is used. This short-term RSI highlights overbought or oversold zones, helping traders filter trades in extreme price conditions.
Only when the trend is validated and price pulls back to one of the MAs will a buy/sell signal be triggered, aligning momentum, price action and timing into a single actionable setup.
This combination ensures that each component plays a specific role:
i) Moving Averages define the trend
ii) MACD validates it
iii) RSI filters noise
iv) Intrabar price action triggers entries
This synchronism helps improve decision-making and entry timing, especially for swing and intraday traders.
---
USE CASES
- Identifying trend continuation setups
- Filtering false signals during consolidation phases
- Avoiding trades in overbought or oversold zones
- Enhancing entry timing for both swing and intraday strategies
- Providing visual confirmation of trend strength and momentum alignment
---
KEY FEATURES
1. Dual Moving Average Setup
The indicator allows full customization of two moving averages (MA1 and MA2), supporting both EMA and SMA types. The slope of the longer MA (MA2) acts as an essential trend filter, ensuring signals are only generated when the market shows clear directional bias.
2. MACD Histogram Trend Confirmation
A classic MACD Histogram calculation is used to validate the momentum of the prevailing trend.
- Bullish Trend: Histogram > 0
- Bearish Trend: Histogram < 0
This step filters out counter-trend signals and ensures trades are aligned with momentum.
3. Intrabar Price Trigger
Unlike standard crossover systems, this indicator waits for intrabar price action to trigger entries:
- Buy Signal: Price crosses below one of the MAs during an uptrend (dip-buy logic)
- Sell Signal: Price crosses above one of the MAs during a downtrend (rally-sell logic)
This intrabar trigger improves entry timing and helps capture retracement-based opportunities.
4. RSI Visual Filter
A short-term RSI is plotted and color-coded to visually highlight overbought and oversold conditions, acting as a discretionary filter for users to avoid low-probability trades during exhaustion points.
5. Dynamic Coloring System
Bar Colors:
- Blue: Bullish trend
- Red: Bearish trend
- Orange: RSI Overbought/Oversold zones
MA Colors:
- Blue for bullish conditions
- Red for bearish conditions
- Gray for neutral/no-trend phases
6. Signal Markers and Alerts
Clear visual buy and sell markers are plotted directly on the chart.
Additionally, the indicator includes real-time alerts for both Buy and Sell signals, helping traders stay informed even when away from the screen.
---
INPUTS AND CUSTOMIZATION OPTIONS
- Moving Average Types: EMA or SMA for both MA1 and MA2.
- MACD Settings: Customizable fast, slow, and signal periods.
- RSI Settings: Source, length, and overbought/oversold levels fully adjustable.
- Color Customization: Adjust RSI zone colors to suit your chart theme.
---
DISCLAIMER
This indicator is a technical analysis tool designed for educational and informational purposes only. It should not be used as a standalone trading system. Always combine it with sound risk management, price action analysis, and, where applicable, fundamental context.
Past performance does not guarantee future results.
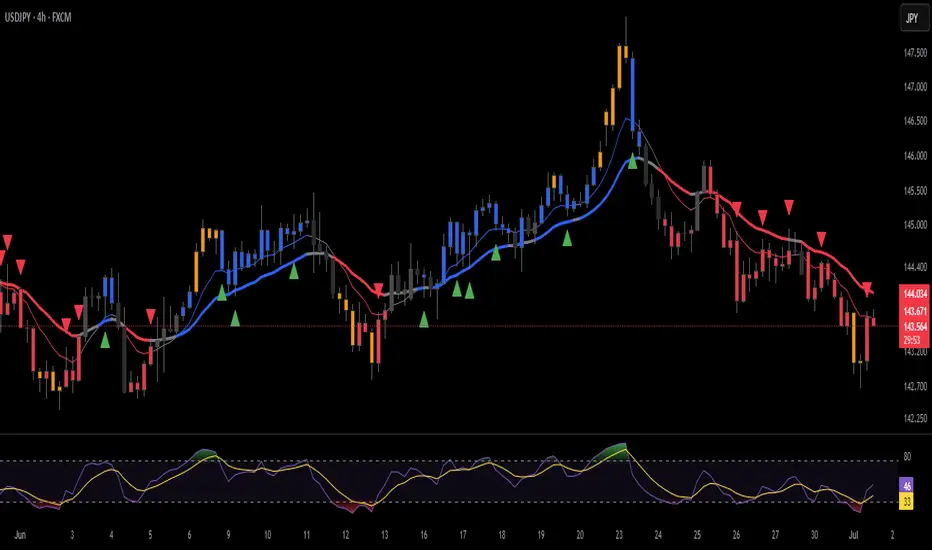
Buy Opportunity Score Table (21 Points)## 📊 Script Title:
**Buy Opportunity Score Table (21 Points)**
---
## 📝 Script Description:
This TradingView script is a **custom multi-indicator scoring system** designed to identify **buying opportunities** in stocks, indices, or ETFs by evaluating momentum, volume strength, and overall market sentiment. It gives a score out of **21 points** using 6 key indicators, and highlights **potential buy signals** when the score crosses **8 points or more**.
---
## ✅ Key Features:
### 📌 1. **Indicators Used (21 Points Max)**
Each of the following indicators contributes up to 4 points (except Nifty trend, which adds 1 point):
| Indicator | Max Points | Logic |
| ----------- | ---------- | ---------------------------------- |
| Volume | 4 | Volume > 20-day average and rising |
| OBV | 4 | OBV rising for 3+ days |
| MFI | 4 | MFI > 60 and increasing |
| RSI | 4 | RSI > 50 and increasing |
| ROC | 4 | Rate of change positive and rising |
| Nifty Trend | 1 | Nifty > yesterday and above 20 EMA |
---
### 📌 2. **Scoring Output**
* The **total score** is plotted on the chart and capped at 21.
* Score of **8 or higher** is treated as a **buy trigger**.
* Permanent horizontal lines are plotted at **8**, **13**, and **17** to show key levels:
* **8** → Entry zone
* **13** → Accumulation/Build zone
* **17** → Strong bullish momentum
---
### 📌 3. **Table Panel (Top Right Corner)**
A table shows:
* Current and previous day’s score for each indicator
* Total score and change from previous day
---
### 📌 4. **Visual Aids**
* Background turns **green** when score is **≥ 8**
* Permanent **horizontal lines** at score levels **8, 13, and 17** for easy reference
---
### 📌 5. **Alerts**
* An `alertcondition` is triggered **when score crosses 8 from below**
* You can use this for mobile/email alerts or automated strategies
---
## ⚙️ Inputs:
You can customize:
* Length of **ROC**, **MFI**, **RSI**, and **Volume SMA**
Default values are:
* ROC: 10
* MFI: 14
* RSI: 14
* Volume MA: 20
---
## 🎯 Use Case:
This tool is ideal for:
* **Swing traders** looking for early signals of accumulation
* **Investors** filtering stocks with rising internal strength
* **Algo traders** building signal-based strategies based on multi-factor models

Volume Exhaustion RSI Reversal StrategyKey Features:
Volume Logic:
1. Identifies two consecutive red bars (down periods) or green bars (up periods)
2. First down or up bars has the highest volume of the three
3. Volume decreases on the second down or up bars
4. Current (third) bar is green for up Reversal or red for down Reversal with higher volume than second bar
RSI Logic:
Uses standard 14-period RSI
Detects "V" shape pattern (decline, trough, rise)
Requires trough value <= 30 (oversold condition) or <= 70 (overbought condition)
Current bar shows RSI rising from trough
Execution:
Enters long/Short position when both volume and RSI conditions are met
Plots green "BUY/SELL" labels below the trigger candle
Visualization:
Green "BUY/SELL" labels appear below qualifying candles
Strategy positions shown in the strategy tester
How To Use:
Apply to any timeframe (works best on 5M-15M charts)
Combine with price action confirmation for example when candle 3 closes above candle 2 for "BUY" Or when Closes below for "SELL"
Ideal for oversold reversals in downtrends
Works best with volume-based assets
Note: The strategy enters at the close of the trigger candle. Always backtest before live trading and consider adding stop-loss protection.
