OPEN-SOURCE SCRIPT
Aggiornato Clean OHLC Lines | Baks

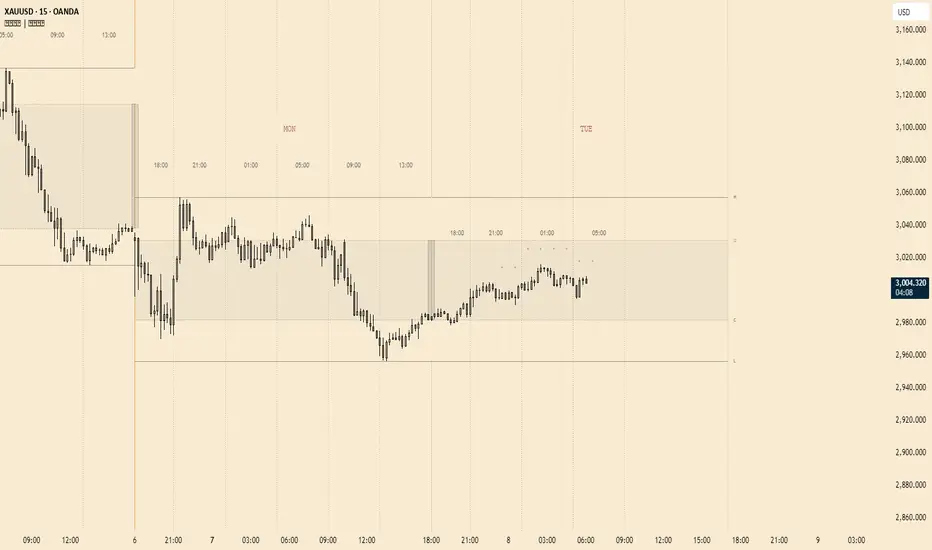
Plots clean, non-repainting OHLC lines from higher timeframes onto your chart. Ideal for tracking key price levels (open, high, low, close) with precision and minimal clutter.
Core Functionality
Clean OHLC Lines = Historical Levels + Non-Repainting Logic
• Uses lookahead=on to anchor historical lines, ensuring no repainting.
• Displays OHLC lines for customizable timeframes (15min to Monthly).
• Optional candlestick boxes for visual context.
Key Features
• Multi-Timeframe OHLC:
Plot lines from 15min, 30min, 1H, 4H, Daily, Weekly, or Monthly timeframes.
• Non-Repainting Logic:
Historical lines remain static and never recalculate.
• Customizable Styles:
Adjust colors, line widths (1px-4px), and transparency for high/low/open/close lines.
• Candle Display:
Toggle candlestick boxes with bull/bear colors and adjustable borders.
• Past Lines Limit:
Control how many historical lines are displayed (1-500 bars).
User Inputs
• Timeframe:
Select the OHLC timeframe (e.g., "D" for daily).
• # Past Lines:
Limit historical lines to avoid overcrowding (default: 10).
• H/L Mode:
Draw high/low lines from the current or previous period.
• O/C Mode:
Anchor open/close lines to today’s open or yesterday’s close.
• Line Styles:
Customize colors, transparency, and styles (solid/dotted/dashed).
• Candle Display:
Toggle boxes/wicks and adjust bull/bear colors.
Important Notes
⚠️ Alignment:
• Monthly/weekly timeframes use fixed approximations (30d/7d).
• For accuracy, ensure your chart’s timeframe ≤ the selected OHLC timeframe (e.g., use 1H chart for daily lines).
⚠️ Performance:
• Reduce # Past Lines on low-end devices for smoother performance.
Risk Disclaimer
Trading involves risk. OHLC lines reflect historical price levels and do not predict future behavior. Use with other tools and risk management.
Open-Source Notice
This script is open-source under the Mozilla Public License 2.0. Modify or improve it freely, but republishing must follow TradingView’s House Rules.
📈 Happy trading!
Note di rilascio
ADDED FEATURES:LINE SHIFT
· Introducing a new mode! This feature captures past OHLC lines and extends them to the current time. You can easily control how far back in time the lines are captured using a customizable number input.
TIMEFRAME
· The indicator now supports the Default Timeframe option, making it more flexible and aligned with your chart settings.
Note di rilascio
ADDED LABELS· You can tooltip the labels to see the price range or price.
Note di rilascio
LABEL UPDATE· Added OHLC price in the tooltip.
Note di rilascio
ADDED A NEW FEATURE!DIVIDER LINES
· Introducing a customizable timeframe divider! This feature allows you to visually separate sessions or timeframes with adjustable styles, colors, and historical line display for enhanced chart clarity.
Note di rilascio
UPDATE• Added Closing Line Color customization
• Smart Dividers – Added more customizable dividers with labels and interactive tooltips (hover for details)
Note di rilascio
UPDATE:You can now choose to display Close and Open lines in the "O/C Mode".
Read tooltips.
Note di rilascio
NEW FEATURES:Improved indicator appearance – Enhanced visual design for better clarity.
Added O+C Box – Now available in the Candle Display Options.
Added 1 more divider – Now features a total of four dividers.
Note di rilascio
Update:Added customizable text/shape options for divider labels to reduce clutter.
Time + timeframe are now displayed in divider label tooltips.
Script open-source
Nello spirito di TradingView, l'autore di questo script lo ha reso open source, in modo che i trader possano esaminarne e verificarne la funzionalità. Complimenti all'autore! Sebbene sia possibile utilizzarlo gratuitamente, ricordiamo che la ripubblicazione del codice è soggetta al nostro Regolamento.
Declinazione di responsabilità
Le informazioni e le pubblicazioni non sono intese come, e non costituiscono, consulenza o raccomandazioni finanziarie, di investimento, di trading o di altro tipo fornite o approvate da TradingView. Per ulteriori informazioni, consultare i Termini di utilizzo.