OPEN-SOURCE SCRIPT
Aggiornato Squeeze Momentum Indicator [LazyBear] vX by DGT
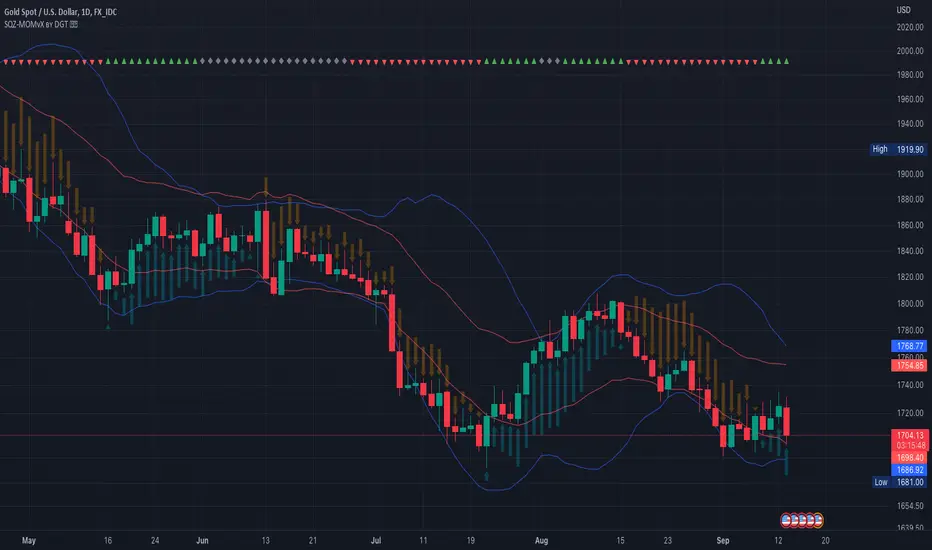
Modified version of Squeeze Momentum Indicator [LazyBear] visualizing on Price Chart
author: LazyBear, modified by KıvançÖZBİLGİÇ
author: LazyBear, modified by KıvançÖZBİLGİÇ
Note di rilascio
small update: Keltner Channel calculations replaced by kc(series, length, mult, useTrueRange) build-in function Note di rilascio
enhancementThe Squeeze Indicator measures the relationship between Bollinger Bands and Keltner's Channels to help identify consolidations and signal when prices are likely to break out (whether up or down).
The Squeeze Indicator finds sections of the Bollinger Bands which fall inside the Keltner's Channels and in this case the market is said to be in a squeeze (indicator turns off, displayed with grey diamond shapes in this study)
When the volatility increases, so does the distance between the bands, conversely, when the volatility declines, the distance also decreases and in such cases the squeeze is said to be released (indicator turns on, displayed with triangle up or triangle down shapes)
To produce Buy/Sell signals, the Squeeze indicator is plotted along with Momentum Oscillator
When the indicator is on and the Momentum Oscillator Histogram is green, it is considered a Buy signal (this signal is supposed to be correct until two green bars in a row).
When the indicator is on and the Momentum Oscillator Histogram is red, it is considered a Sell signal (this signal is supposed to be correct until two red bars in a row).
When the market finishes a move, the indicator turns off (grey) and no trade is recommended
Note di rilascio
Update- Multi TimeFrame ability added
- The Squeeze Indicator measures the relationship between Bollinger Bands and Keltner's Channels, hence made them optionally visable
- Removed Label
Note di rilascio
Update * Squeeze Release Alert Addition
* Pine Script v5 Update
Script open-source
In pieno spirito TradingView, il creatore di questo script lo ha reso open-source, in modo che i trader possano esaminarlo e verificarne la funzionalità. Complimenti all'autore! Sebbene sia possibile utilizzarlo gratuitamente, ricorda che la ripubblicazione del codice è soggetta al nostro Regolamento.
Our Premium Indicators: sites.google.com/view/solemare-analytics
Declinazione di responsabilità
Le informazioni ed i contenuti pubblicati non costituiscono in alcun modo una sollecitazione ad investire o ad operare nei mercati finanziari. Non sono inoltre fornite o supportate da TradingView. Maggiori dettagli nelle Condizioni d'uso.