OPEN-SOURCE SCRIPT
Lowry Upside % Volume
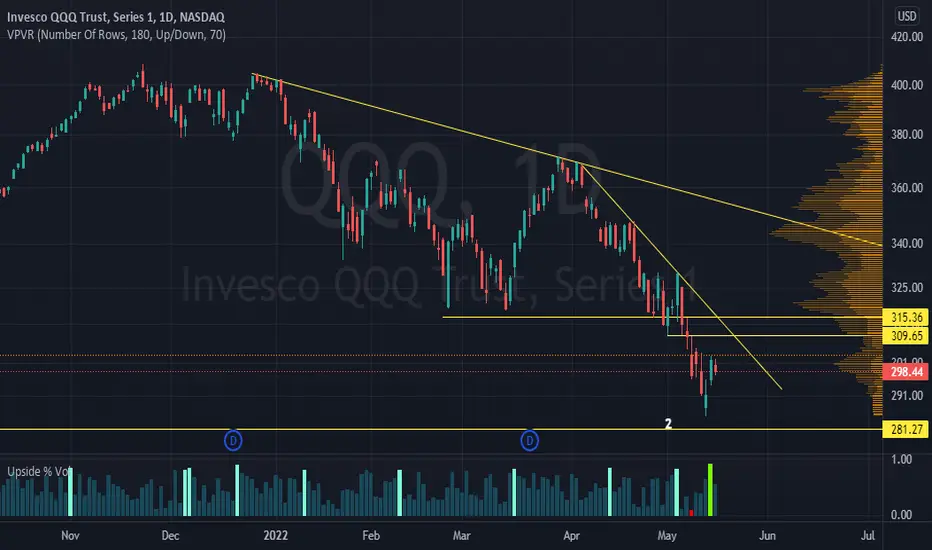
This script takes the total NYSE volume for the day and determines what percentage of that volume is Upside Volume (or buying volume).
What's different in this script compared to others is that the 3 most essential values determined by Paul F. Desmond's Dow Award-winning paper for Lowry's Reports are color coded:
1) 90% Upside Volume Day
2) 80% Upside Volume Day
3) 90% Downside Volume Day
According to Paul's award-winning research, these precise criteria are objective definitions of panic selling and panic buying and are generally near major market tops and bottoms.
His Dow Award-winning paper on the topic can be explored and scrutinized in more detail here:
docs.cmtassociation.org/docs/2002DowAwardb.pdf
Script open-source
Nello spirito di TradingView, l'autore di questo script lo ha reso open source, in modo che i trader possano esaminarne e verificarne la funzionalità. Complimenti all'autore! Sebbene sia possibile utilizzarlo gratuitamente, ricordiamo che la ripubblicazione del codice è soggetta al nostro Regolamento.
Declinazione di responsabilità
Le informazioni e le pubblicazioni non sono intese come, e non costituiscono, consulenza o raccomandazioni finanziarie, di investimento, di trading o di altro tipo fornite o approvate da TradingView. Per ulteriori informazioni, consultare i Termini di utilizzo.