OPEN-SOURCE SCRIPT
CMP vs ATH Percentage
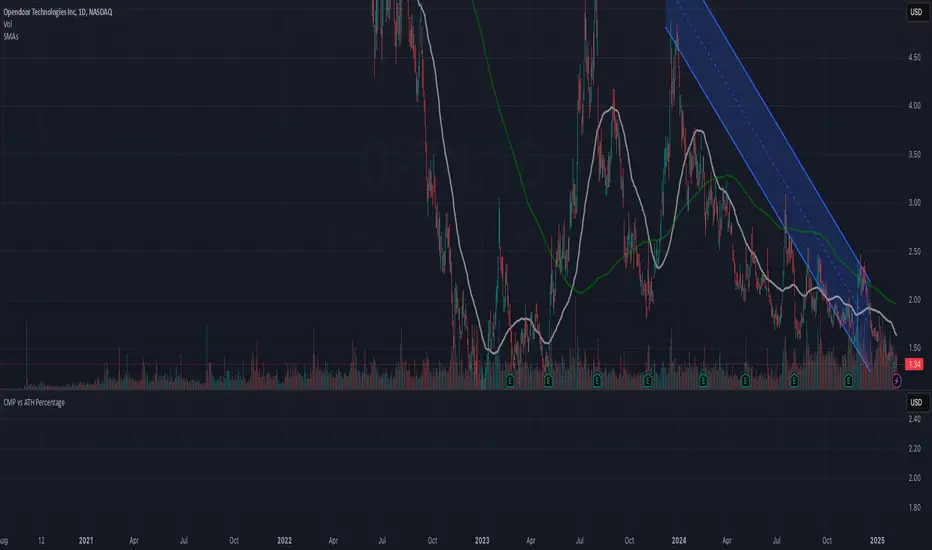
This indicator helps traders and investors track how the current market price (CMP) compares to the all-time high (ATH) price of an asset. It calculates the percentage difference between the CMP and ATH and displays it visually on the chart. A label is placed on the latest bar, showing key information like:
ATH (All-Time High Price)
CMP (Current Market Price)
Percentage Comparison (CMP as a percentage of ATH)
Additionally, the indicator plots a horizontal line at the ATH level to provide a clear visual reference for the price history.
Use Cases:
Identify price levels relative to historical highs.
Gauge whether the price is nearing or far from its ATH.
Quickly assess how much the price has recovered or declined from the ATH.
Customization:
You can modify the label's style, color, or text formatting according to your preferences. This indicator is useful for long-term analysis, especially when tracking stocks, indices, or other financial instruments on a weekly timeframe.
Note:
This indicator is designed to work on higher timeframes (e.g., daily or weekly) where ATH levels are more meaningful.
Script open-source
Nello spirito di TradingView, l'autore di questo script lo ha reso open source, in modo che i trader possano esaminarne e verificarne la funzionalità. Complimenti all'autore! Sebbene sia possibile utilizzarlo gratuitamente, ricordiamo che la ripubblicazione del codice è soggetta al nostro Regolamento.
Declinazione di responsabilità
Le informazioni e le pubblicazioni non sono intese come, e non costituiscono, consulenza o raccomandazioni finanziarie, di investimento, di trading o di altro tipo fornite o approvate da TradingView. Per ulteriori informazioni, consultare i Termini di utilizzo.