OPEN-SOURCE SCRIPT
Mikes 5 min HHLL Spotter
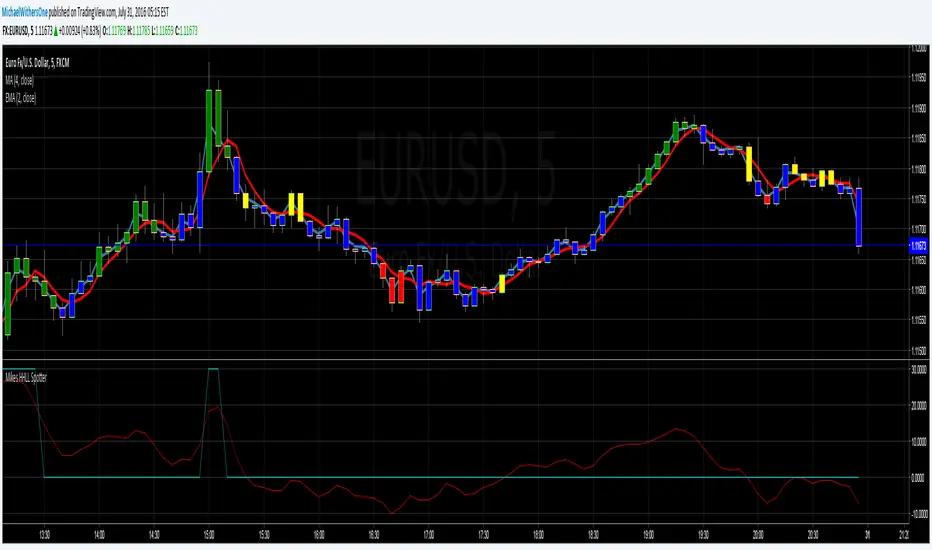
Attempts to find higher highs and lower lows in the 5 minute window. When the light blue graph line peaks , you should investigate selling , when the light blue graph line dips you should investigate buying.
This is good for identifying oversold and over bought positions
This is good for identifying oversold and over bought positions
Script open-source
Nello spirito di TradingView, l'autore di questo script lo ha reso open source, in modo che i trader possano esaminarne e verificarne la funzionalità. Complimenti all'autore! Sebbene sia possibile utilizzarlo gratuitamente, ricordiamo che la ripubblicazione del codice è soggetta al nostro Regolamento.
Declinazione di responsabilità
Le informazioni e le pubblicazioni non sono intese come, e non costituiscono, consulenza o raccomandazioni finanziarie, di investimento, di trading o di altro tipo fornite o approvate da TradingView. Per ulteriori informazioni, consultare i Termini di utilizzo.