OPEN-SOURCE SCRIPT
PA ScratchiCloud
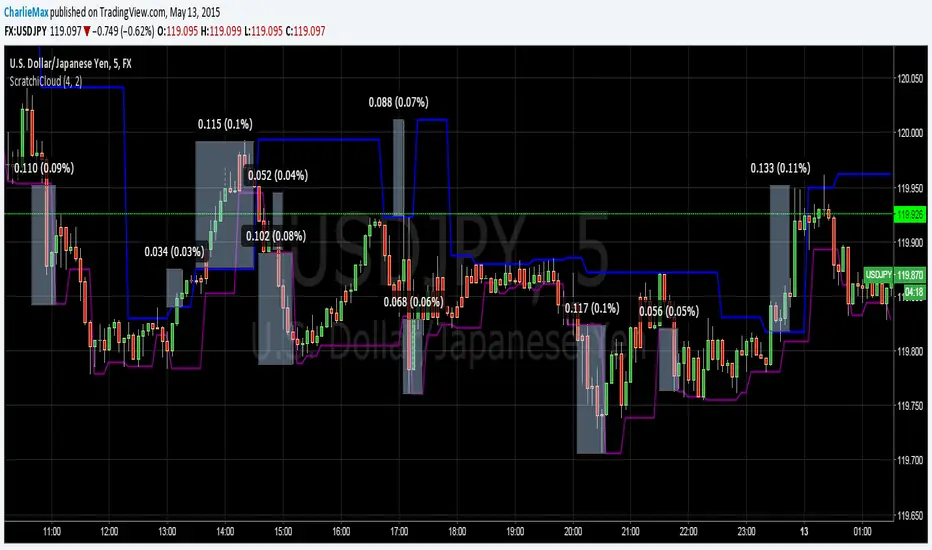
This indicator is a modification of Golgistain's Hi/Lo Pivot indicator. I added a shorter length 2 to get early entries on short positions.
The way it works is you choose a timeframe you would like to trade and then set the indicator length to match the candle price action patterns. Default is M5 chart with 4/2 for the indicators.
Rules: Take the trade when price breaks out the top or bottom of the line.
Exit: Take what you can get and give nothing back.
Good luck - CharlieMax :0)
Script open-source
Nello spirito di TradingView, l'autore di questo script lo ha reso open source, in modo che i trader possano esaminarne e verificarne la funzionalità. Complimenti all'autore! Sebbene sia possibile utilizzarlo gratuitamente, ricordiamo che la ripubblicazione del codice è soggetta al nostro Regolamento.
Declinazione di responsabilità
Le informazioni e le pubblicazioni non sono intese come, e non costituiscono, consulenza o raccomandazioni finanziarie, di investimento, di trading o di altro tipo fornite o approvate da TradingView. Per ulteriori informazioni, consultare i Termini di utilizzo.