OPEN-SOURCE SCRIPT
Aggiornato trendline function - JD
!EXPERIMENTAL!
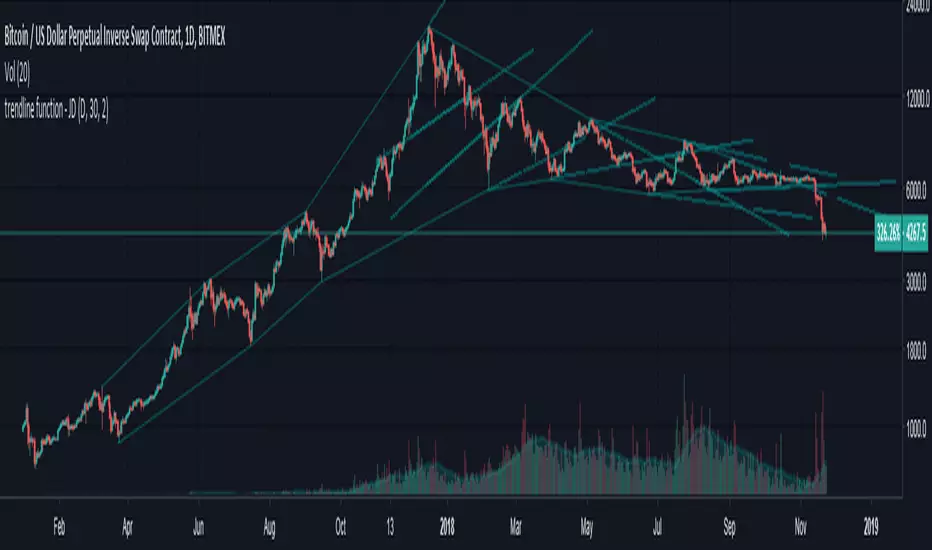
As TV doesn't provide a function to draw lines between points, I wrote a function to do this in one my own indicators.
The function itself however can be applied/modified for different use cases, eg. drawing trendlines.
In this (proof of concept) example I used it to draw lines based on past high/low pivot points.
The inputs required:
* an INPUT FUNCTION (in this form, its designed to work with functions that have occasional values and na-values between them, it then connects the non-zero values to form a line)
* a BOOL (to indicate if you want to draw only the rising or falling lines)
* a DELAY (in this case this is the lookback period for the pivot-points function, this is to compensate the calculation of the past and realtime points)
The function returns:
* the function to draw the extension from the BASE-LINE to the current time (here this is the connection of the last pivot-point to the current point to bridge the gap of the lookback period, this is NOT REALTIME!)
* the function to draw the extension for the current time (here this is the continuation of the line until a new pivot-point is valid, this is DRAWN IN REALTIME!!)
* the color of the lines (in this case the lines are only colored (lime or fuchsia) if they either go up or down, else they are invisible, this is to clean up the invalid lines)
these output functions can then simply be plotted using the 'plot' function.
JD.
Note di rilascio
* Added MTF option* Added choice between colored or monochrome lines
* Added option to show only falling lines for "highs"-trendlines and rising lines for "lows"-trendlines or show all calculated lines
* Added switch between REGULAR and LOGARITHMIC SCALE trendlines !
Any suggestion? Feel free to share!!
JD.
Note di rilascio
fixed cluttered screenshotNote di rilascio
* code clean-up* added option to extend the trendlines to the future (Beta: some gaps may appear,... still working on that ;-) ! )
JD.
Script open-source
Nello spirito di TradingView, l'autore di questo script lo ha reso open source, in modo che i trader possano esaminarne e verificarne la funzionalità. Complimenti all'autore! Sebbene sia possibile utilizzarlo gratuitamente, ricordiamo che la ripubblicazione del codice è soggetta al nostro Regolamento.
Disclaimer.
I AM NOT A FINANCIAL ADVISOR.
THESE IDEAS ARE NOT ADVICE AND ARE FOR EDUCATION PURPOSES ONLY.
ALWAYS DO YOUR OWN RESEARCH!
JD.
You can contact me for info/access in PM or on Telegram: @jduyck
PLS, DON'T ASK FOR ACCESS IN THE COMMENT SECTION!
I AM NOT A FINANCIAL ADVISOR.
THESE IDEAS ARE NOT ADVICE AND ARE FOR EDUCATION PURPOSES ONLY.
ALWAYS DO YOUR OWN RESEARCH!
JD.
You can contact me for info/access in PM or on Telegram: @jduyck
PLS, DON'T ASK FOR ACCESS IN THE COMMENT SECTION!
Declinazione di responsabilità
Le informazioni e le pubblicazioni non sono intese come, e non costituiscono, consulenza o raccomandazioni finanziarie, di investimento, di trading o di altro tipo fornite o approvate da TradingView. Per ulteriori informazioni, consultare i Termini di utilizzo.
Script open-source
Nello spirito di TradingView, l'autore di questo script lo ha reso open source, in modo che i trader possano esaminarne e verificarne la funzionalità. Complimenti all'autore! Sebbene sia possibile utilizzarlo gratuitamente, ricordiamo che la ripubblicazione del codice è soggetta al nostro Regolamento.
Declinazione di responsabilità
Le informazioni e le pubblicazioni non sono intese come, e non costituiscono, consulenza o raccomandazioni finanziarie, di investimento, di trading o di altro tipo fornite o approvate da TradingView. Per ulteriori informazioni, consultare i Termini di utilizzo.