OPEN-SOURCE SCRIPT
Aggiornato Nasan Ultimate Health Index (NUHI)
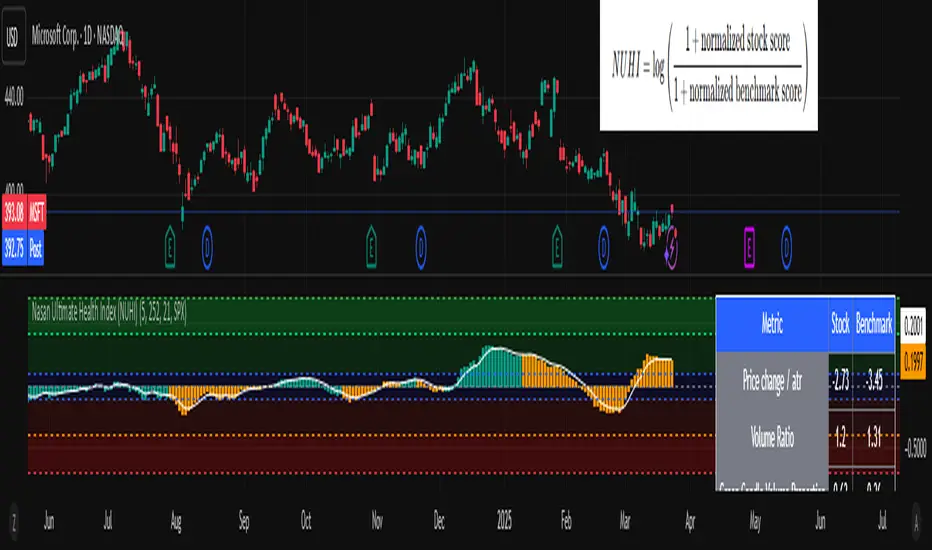
The Nasan Ultimate Health Index (NUHI) is a technical indicator designed to measure the relative health of a stock compared to a benchmark index or sector. By incorporating price action, volume dynamics, and volatility, NUHI provides traders with a clearer picture of a stock’s performance relative to the broader market.
The NUHI is based on the idea that a stock’s relative strength and momentum can be assessed more effectively when adjusted for volume behavior and benchmark comparison. Instead of looking at price movement alone, this indicator factors in:
The stock’s price trend (via EMA)
Volume participation (green vs. red volume) and volume ratio - SMA(volume, 21)/ SMA(volume, 252)
Volatility-adjusted performance (ATR-based scaling)
Comparison with a selected benchmark (e.g., SPX, NDX, sector ETFs)
This results in a normalized and comparative score that helps traders identify outperforming, neutral, and underperforming stocks within a specific market environment.
The NUHI is constructed using the following elements:
1️⃣ Stock Raw Score (Unadjusted Momentum)
The exponential moving average (EMA) of the hlc3 (average of high, low, close) is used to define the price trend.
The difference between the current EMA and the EMA from n bars ago shows whether the stock is gaining or losing momentum.
This difference is divided by the ATR (Average True Range) to adjust for volatility.
2️⃣ Volume Behavior Adjustment
Volume is split into green volume (up candles) and red volume (down candles).
The ratio of green to red volume determines whether buyers or sellers dominate over the selected period (n bars).
If the stock is in an uptrend, green volume is weighted higher; if in a downtrend, red volume is weighted higher.
The stock’s Volume Ratio (short-term SMA divided by long-term SMA) is adjusted based on this weight.
3️⃣ Benchmark Comparison
A similar Raw Score calculation is performed on the selected benchmark (SPX, NDX, or sector ETF).
Benchmark price movements, volume behavior, and ATR adjustments mirror the stock’s calculations.
This provides a reference point for evaluating the stock’s relative strength.
4️⃣ Normalization Process
Both the stock and benchmark raw scores are min-max normalized over the past 252 bars (1-year lookback).
This scales values between 0 and 1, ensuring fair comparisons regardless of absolute price differences.
5️⃣ NUHI Calculation
The final NUHI value is computed using a logarithmic ratio between the normalized stock score and the normalized benchmark score:
This transformation ensures a more symmetrical representation of overperformance and underperformance.
Performance Zones
Strong Outperforming (NUHI between >0.41 and 0.69)
Leading (NUHI between >0.10 and 0.41)
Transitioning Outperformance (NUHI between 0.10 and 0)
Equilibrium (NUHI 0)
Transitioning Underperformance (NUHI between -0.10 and 0)
Lagging (NUHI between < -0.1 and -0.41)
Strong Underperforming (NUHI between< -0.41 and -0.69 )
How to Use NUHI
✅ Identifying Strong Stocks
If NUHI > 0, the stock is outperforming its benchmark.
If NUHI < 0, the stock is underperforming the benchmark.
✅ Trend Confirmation
A steadily rising NUHI and raw score (colored green) suggests sustained strength bullish conditions.
A falling NUHI and raw score (colored orange) indicates weakness and possible rotation into other assets.
✅ Finding Reversals
Bullish Divergence: If NUHI is improving while the stock’s raw score is negative, it may signal a bottoming opportunity.
Bearish Signs: If NUHI is dropping despite price strength, it could hint at underlying weakness.
Why a Stock in a Downtrend Can Have NUHI > 0 (and Vice Versa)
NUHI measures performance relative to both its own history and the benchmark.
A stock’s recent movement is compared to how it usually behaves and how the benchmark is performing.
Example Scenarios:
Stock in a Downtrend but NUHI > 0
The stock may still be in a downtrend (negative raw score), but it’s performing better relative to its past downtrend behavior and better than the benchmark over the same period.
This could mean it’s showing relative strength compared to the broader market or sector.
Stock in an Uptrend but NUHI < 0
Even in a uptrend (positive raw score), the stock might be underperforming relative to its past uptrend behavior and underperforming the benchmark.
What This Means:
NUHI > 0 in a downtrend → The stock is falling less aggressively than usual and/or holding up better than the benchmark.
NUHI < 0 in an uptrend → The stock is gaining less than expected based on its history and/or lagging behind the benchmark.
NUHI helps identify relative strength or weakness .
Note di rilascio
Added NIFTY to benchmark symbols Note di rilascio
Fixed benchmark calculation. Script open-source
Nello spirito di TradingView, l'autore di questo script lo ha reso open source, in modo che i trader possano esaminarne e verificarne la funzionalità. Complimenti all'autore! Sebbene sia possibile utilizzarlo gratuitamente, ricordiamo che la ripubblicazione del codice è soggetta al nostro Regolamento.
Declinazione di responsabilità
Le informazioni e le pubblicazioni non sono intese come, e non costituiscono, consulenza o raccomandazioni finanziarie, di investimento, di trading o di altro tipo fornite o approvate da TradingView. Per ulteriori informazioni, consultare i Termini di utilizzo.
Script open-source
Nello spirito di TradingView, l'autore di questo script lo ha reso open source, in modo che i trader possano esaminarne e verificarne la funzionalità. Complimenti all'autore! Sebbene sia possibile utilizzarlo gratuitamente, ricordiamo che la ripubblicazione del codice è soggetta al nostro Regolamento.
Declinazione di responsabilità
Le informazioni e le pubblicazioni non sono intese come, e non costituiscono, consulenza o raccomandazioni finanziarie, di investimento, di trading o di altro tipo fornite o approvate da TradingView. Per ulteriori informazioni, consultare i Termini di utilizzo.