OPEN-SOURCE SCRIPT
Return & Drawdown
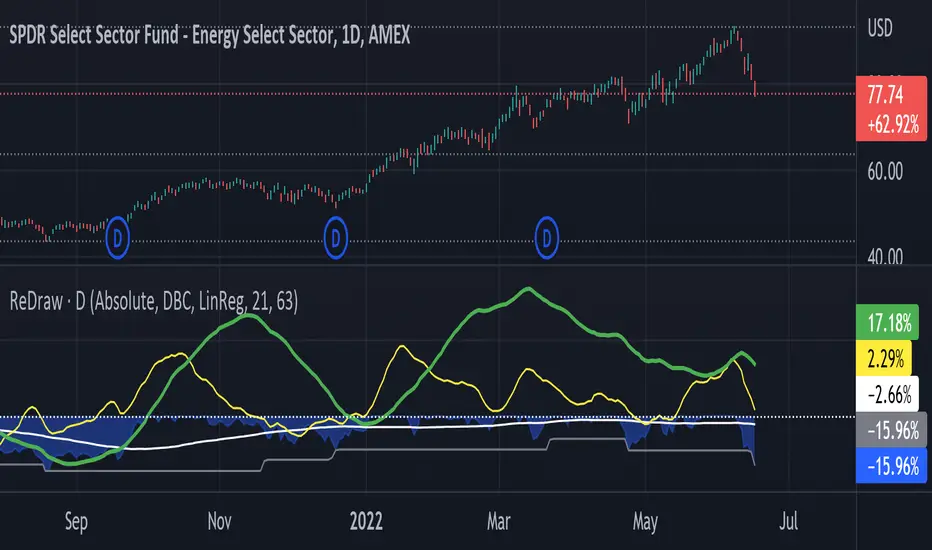
ReDraw script calculates the historical returns and drawdown for the given periods.
By default, the return of the linear regression trends is displayed (can be turned off in settings). In this mode, two linear regression trends are being computed for both long and short periods, and the percent value indicates the "return of the trend" for the corresponding period. Observing the dynamic of the linear regression trends can give a great hint if the trend is slowing down.
When the smoothing method is set to "none" or WMA3/5, the real asset return is shown for both periods, using the formula (LastPrice-FirstPrice)/FirstPrice
The script calculates the maximum drawdown for the long period using the formula (max(Price) - LastPrice) / max(Price).
The white line under the zero is the average maximum drawdown over the long period.
When the mode is set to Compare, ReDraw will display the difference in metrics between the current and selected symbol (SPY by default).
Script open-source
In pieno spirito TradingView, il creatore di questo script lo ha reso open-source, in modo che i trader possano esaminarlo e verificarne la funzionalità. Complimenti all'autore! Sebbene sia possibile utilizzarlo gratuitamente, ricorda che la ripubblicazione del codice è soggetta al nostro Regolamento.
Declinazione di responsabilità
Le informazioni ed i contenuti pubblicati non costituiscono in alcun modo una sollecitazione ad investire o ad operare nei mercati finanziari. Non sono inoltre fornite o supportate da TradingView. Maggiori dettagli nelle Condizioni d'uso.