OPEN-SOURCE SCRIPT
Aggiornato FLEX KDJ IND
Hi Dears!
Here you have this ability to define different methods to aquire high and low bonds in KDJ indicator.
Thses Topologies are available in Popup menu and could be defined by user:
- "AVG" : Use average of cashed data in both High and low Bond
- "MEDIAN" : Use median of cashed data in both High and low Bond
- "MAX" : Use Max of cashed data in both High and low Bond
- "MIN" : Use Min of cashed data in both High and low Bond
- "WIDE" : Use Max of cashed data in High and Min of them for low Bond
- "NARROW" : Use Min of cashed data in High and Max of them for low Bond
- "FIX" : Use predefined constant values by user in 'Max BOND' and 'Min BOND'
- "GAUSS" Use statistical standard deviation method and 'Mult. Max BOND' and 'Mult. Min BOND' to calculate High and low Bond.
In "LEFT RANGE" and "RIGHT RANGE" you can define the range which be used to find pivot and extremum points in calculation of highest and lowest LONG-TERM KDJ Line.
'MEMORY' is the size of cash that you want to collect the extracted data from extreimum points for highest and lowest LONG-TERM-KDJ. If overflowing from this point the oldest value would be kicked from cash.
Other parts are same in KDJ Indicators.
Enjoy trading!
Shakib.
Note di rilascio
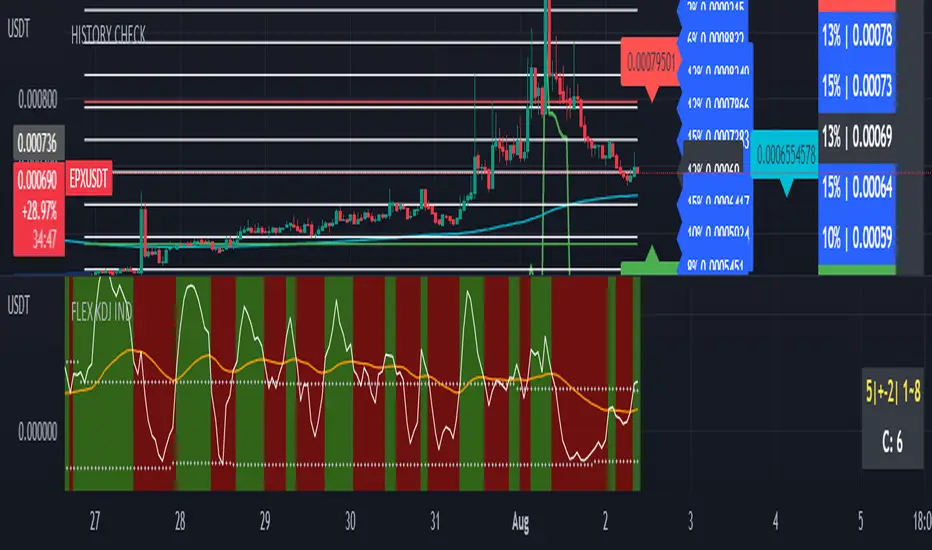
There were two variables that has to be reversed.Add to this now user has a number to guess till when red area would be continued.
Firts number in yellow is the Average, second one is the Std and thirs one is the range.
White value is the current (or the last) counter in red area.
ENJOY!
Note di rilascio
Two smoothing length are now separated to be similar to what we have in KDJ IND in binance.Note di rilascio
I just check it and found that the picture of indicator is not relevant to the indicator! The version is still same as before just pictured in published script is changed.happy trade
Note di rilascio
Hi Dears!in new Version you have two more options for your boundaries definitions:
- [LOWER BOND, UPPER BOND]
Script open-source
In pieno spirito TradingView, il creatore di questo script lo ha reso open-source, in modo che i trader possano esaminarlo e verificarne la funzionalità. Complimenti all'autore! Sebbene sia possibile utilizzarlo gratuitamente, ricorda che la ripubblicazione del codice è soggetta al nostro Regolamento.
Declinazione di responsabilità
Le informazioni ed i contenuti pubblicati non costituiscono in alcun modo una sollecitazione ad investire o ad operare nei mercati finanziari. Non sono inoltre fornite o supportate da TradingView. Maggiori dettagli nelle Condizioni d'uso.