OPEN-SOURCE SCRIPT
Accumulation / Manipulation / Distribution [mqsxn]
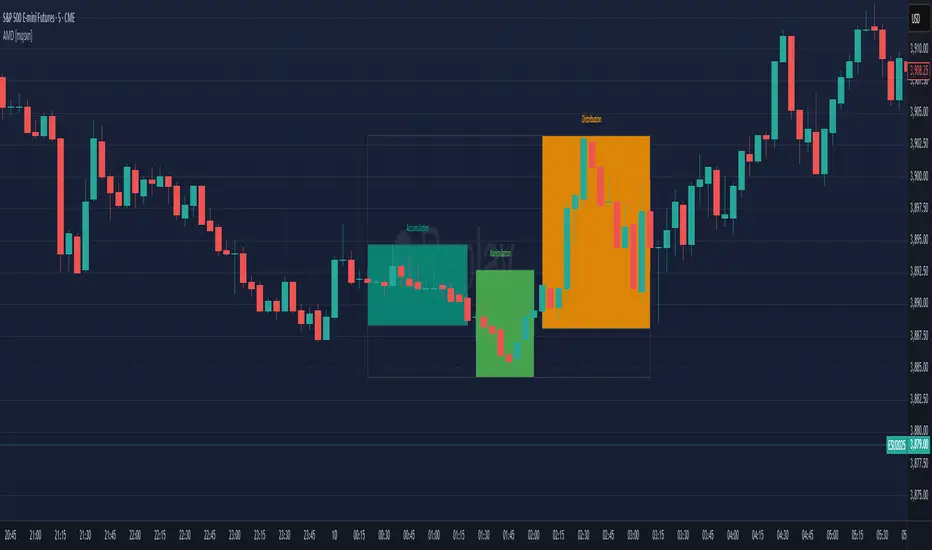
Spot, box, and label classic A→M→D market structure in real time.
This tool objectively classifies price action into Accumulation, Manipulation, and Distribution phases, draws a box around each qualifying segment, and (optionally) only reveals clean, direct A→M→D triplets. It works on any symbol and timeframe, and supports nested triplets (smaller AMD sequences appearing inside larger ones).
Accumulation (A) — Compression bars: range is small vs ATR and body is relatively small.
Manipulation (M) — Stop-run + rejection: takes out a prior swing (high or low), shows a long wick, and (optionally) closes back inside the prior range.
Distribution (D) — Expansion + drive: range expands vs ATR, close is near an extreme and aligns with EMA slope.
Contiguous bars with the same phase form a segment. Each finalized segment becomes a box spanning that segment’s high/low and first/last bars. Segments below your minimum bar thresholds are discarded (no box). Labels are plain text at the top-center of each visible box; label color matches the box fill, and you can nudge it upward by a configurable tick offset.
When three consecutive segments form A→M→D, the indicator can (optionally) draw an outline around their combined span and, if you enable the filter, hide everything that isn’t part of such a direct triplet (no border, no label on non-triplet segments).
Key features
- Objective AMD detection (ATR, wick fraction, EMA slope, swing breaks)
- Minimum bars per phase (default 3/3/3) to avoid micro noise
- Only show direct A→M→D filter to keep charts clean
- Triplet outline box (configurable history length)
- Top-center labels (plain text, no background; color = box fill; configurable vertical offset)
- Optional A/M/D dots at the top of the chart for quick bar-by-bar debugging
- Works on any timeframe; supports nested AMD sequences
Inputs
Core
- ATR Lookback (14)
- Trend EMA (21)
- Swing Ref (10)
Accumulation
- Range < ATR × (0.55)
- Body / Range ≤ (0.45)
Manipulation
- Min Wick Fraction (0.6)
- Close Back Inside Prior Range (On)
Distribution
- Range ≥ ATR × (1.2)
- Close near extreme ≤ (0.25)
Minimum Candles per Section
- Min bars for Accumulation (3)
- Min bars for Manipulation (3)
- Min bars for Distribution (3)
Visualization
- Phase fill colors (A / M up / M down / D up / D down)
- Box Border color
- Extend boxes right (bars)
- Show Phase Labels (On)
- Label Font Size
- Label Offset (ticks above box top)
Filters
- Only show boxes that are part of a direct A→M→D sequence (On by default)
AMD Triplet Outline
- Draw outline (On)
- Outline Border color
- Keep last N outlines (20)
Debug / Markers
- Show A/M/D dots at top (Off by default)
Advanced
- Priority: Manipulation overrides others (On)
- Carry last phase through “None” bars (On)
Follow mqsxn for updates on this indicator, and find my strategies and more in my paid Discord: whop.com/checkout/plan_oAIXFOiCZlHmk?d2c=true
Script open-source
In pieno spirito TradingView, il creatore di questo script lo ha reso open-source, in modo che i trader possano esaminarlo e verificarne la funzionalità. Complimenti all'autore! Sebbene sia possibile utilizzarlo gratuitamente, ricorda che la ripubblicazione del codice è soggetta al nostro Regolamento.
Declinazione di responsabilità
Le informazioni ed i contenuti pubblicati non costituiscono in alcun modo una sollecitazione ad investire o ad operare nei mercati finanziari. Non sono inoltre fornite o supportate da TradingView. Maggiori dettagli nelle Condizioni d'uso.