OPEN-SOURCE SCRIPT
Aggiornato Gold Valuation
Gold Value Index
The Gold Value Index (GVI) is a macro-driven oscillator that estimates the relative value of gold based on real-time movements in the US Dollar Index (DXY) and the 10-Year US Treasury Yield (US10Y). It helps traders contextualize gold’s price within broader macroeconomic pressure — identifying when gold may be over- or undervalued relative to these key drivers.
How It Works – Macro Inputs:
DXY (US Dollar Index): Typically moves inversely to gold. A rising dollar suggests downward pressure on gold value.
US10Y Yield: Higher yields increase the opportunity cost of holding gold, often leading to weaker gold prices.
Both inputs are Z-score normalized and inverted to reflect their typical negative correlation with gold. When combined, they form a single, scaled index from 0 (undervalued) to 100 (overvalued).
Why Use This Tool?
Gold reacts to macro forces as much as technical ones. The GVI blends these inputs into a clear, visual gauge to:
Anticipate mean-reversion setups.
Avoid emotionally-driven trades in extreme macro conditions.
Enhance timing by understanding gold's macro context.
Important Notes:
Data sources include ICEUS:DXY and TVC:US10Y via TradingView.
Code is protected — this is a private, invite-only script.
Note di rilascio
Gold Value Index – Invite-Only ScriptThe Gold Value Index (GVI) is a macro-driven oscillator that estimates the relative value of gold based on real-time movements in the US Dollar Index (DXY) and the 10-Year US Treasury Yield (US10Y). It helps traders contextualize gold’s price within broader macroeconomic pressure — identifying when gold may be over- or undervalued relative to these key drivers.
How It Works – Macro Inputs:
DXY (US Dollar Index): Typically moves inversely to gold. A rising dollar suggests downward pressure on gold value.
US10Y Yield: Higher yields increase the opportunity cost of holding gold, often leading to weaker gold prices.
Both inputs are Z-score normalized and inverted to reflect their typical negative correlation with gold. When combined, they form a single, scaled index from 0 (undervalued) to 100 (overvalued).
Why Use This Tool?
Gold reacts to macro forces as much as technical ones. The GVI blends these inputs into a clear, visual gauge to:
Anticipate mean-reversion setups.
Avoid emotionally-driven trades in extreme macro conditions.
Enhance timing by understanding gold's macro context.
Important Notes:
Data sources include ICEUS:DXY and TVC:US10Y via TradingView.
Code is protected — this is a private, invite-only script.
Note di rilascio
Gold Value Index (Macro-Weighted Oscillator)The Gold Value Index (GVI) is a macro-informed oscillator that measures gold’s valuation in real-time relative to core macroeconomic forces — the US Dollar Index (DXY) and US 10-Year Treasury Yield (US10Y). The tool is designed to help traders time gold mean-reversion trades, avoid FOMO during extremes, and gain macro context for technical setups.
How It Works – Components:
Z-Score Normalization:
Both DXY and US10Y are normalized using a Z-score formula, measuring how far their current price deviates from the mean in standard deviations. This makes different scales comparable and captures relative strength.
Inverse Correlation with Gold:
Since DXY and US10Y tend to move opposite to gold, their Z-scores are inverted. A rising DXY or yield typically pressures gold down — this relationship is built into the model.
Weighted Average Logic:
You can toggle DXY and/or US10Y individually. The script automatically adjusts weightings based on active components to maintain signal integrity.
Scaled Output:
The combined score is transformed into a 0–100 scale:
0–25 = Undervalued
75–100 = Overvalued
50 = Neutral
⚙️ Unique Enhancements:
✅ Trend Filter using adjustable EMA
✅ Volatility Filter with ATR threshold
✅ Signal Cooldown to reduce noise
✅ Optional macro input toggles
These additions ensure the script gives only high-probability, trend-aligned reversal signals in macro extremes — unlike traditional oscillators that may constantly flip in choppy environments.
🧭 How to Use:
Works well on 1H–4H–Daily timeframes
Combine with price action or other macro indicators
Ideal for swing and position traders looking to align trades with macro pressure
🔍 Data Sources:
ICEUS:DXY for US Dollar Index
TVC:US10Y for Treasury Yield
Note di rilascio
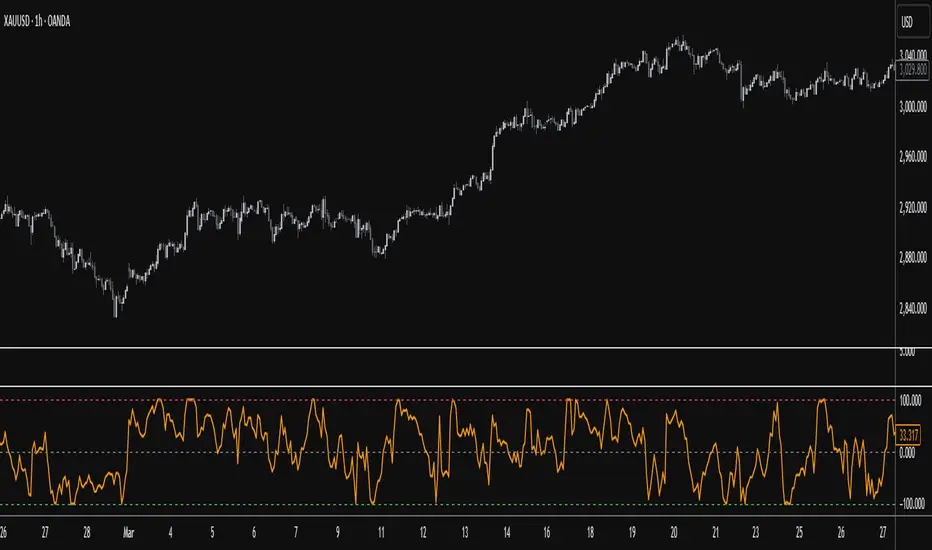
Gold Valuation IndexThe Gold vs Dollar Valuation Index is a custom indicator that evaluates the relative valuation of gold in the context of key macroeconomic forces: the U.S. Dollar (via the DXY Index) and the 10-Year U.S. Treasury Yield (US10Y). Designed for traders, analysts, and investors, this tool helps contextualize gold’s current strength or weakness within the broader economic environment.
🎯 Purpose
This indicator provides a normalized score on a scale from -100 to +100, representing gold's valuation relative to external macro factors:
Positive values (above 0) suggest gold is strong compared to the dollar and/or interest rates — potentially overvalued.
Negative values (below 0) suggest relative weakness — possibly undervalued.
Zero (0) indicates a neutral valuation in macroeconomic terms.
⚙️ How It Works
The indicator uses Z-score normalization to compare:
Gold price (always included),
DXY index (optional),
10-Year Treasury yield (optional).
These values are blended into a composite index, then scaled to a symmetric range of -100 to +100. This gives a clear and intuitive view of how gold performs in relation to macroeconomic pressures.
🔧 User Settings
Users can customize the indicator via:
Z-Score Length: Number of periods for normalization (default: 50).
Include DXY: Toggle to include/exclude the U.S. Dollar Index.
Include 10Y Yield: Toggle to include/exclude interest rate influence.
This flexibility makes the indicator adaptable to various economic conditions and trading strategies.
📊 Visual Representation
The indicator plots a dynamic line on a -100 to +100 scale, with reference levels at:
+100 (Overvalued) — potential caution or profit-taking zone,
0 (Neutral) — balanced macroeconomic valuation,
-100 (Undervalued) — potential buying opportunity.
🧠 Use Cases
Macro context for gold: Understand gold’s position relative to economic drivers.
Timing tool: Enhance decisions on gold-related trades (GLD, GDX, XAU/USD).
Sentiment filter: Identify extreme divergences that may signal opportunity or risk.
📌 Note
This indicator is meant to provide contextual insight, not standalone buy/sell signals. For best results, use it in combination with other tools such as price action, volume, or fundamental analysis.
🔔 Disclaimer: This tool is intended for educational and analytical purposes. Always conduct your own research and risk management before making trading decisions. Past performance does not guarantee future outcomes.
Script open-source
Nello spirito di TradingView, l'autore di questo script lo ha reso open source, in modo che i trader possano esaminarne e verificarne la funzionalità. Complimenti all'autore! Sebbene sia possibile utilizzarlo gratuitamente, ricordiamo che la ripubblicazione del codice è soggetta al nostro Regolamento.
Declinazione di responsabilità
Le informazioni e le pubblicazioni non sono intese come, e non costituiscono, consulenza o raccomandazioni finanziarie, di investimento, di trading o di altro tipo fornite o approvate da TradingView. Per ulteriori informazioni, consultare i Termini di utilizzo.