OPEN-SOURCE SCRIPT
KAI QUANTUM Candles Analysis - Yearly Breakdown
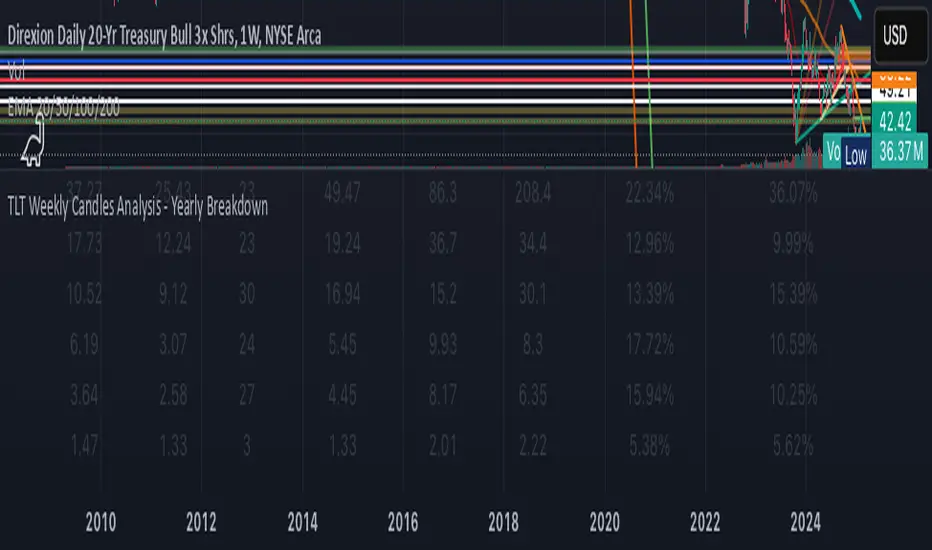
The "KAI QUANTUM Analysis – Yearly Breakdown" indicator offers a comprehensive, year-by-year examination of candlestick behavior, enabling traders and analysts to gauge market dynamics over extended periods. Key features include:
Yearly Aggregation:
The indicator groups candlestick data by year, providing a clear snapshot of market behavior for each period.
Dual-Color Analysis:
It categorizes candles as bullish (green) or bearish (red) and computes statistics separately for each, allowing you to assess both upward and downward market trends.
Average Body Size & Candle Count:
For each year, the indicator calculates the average body size of green and red candles and tracks the total number of each, helping you understand overall market volatility and momentum.
Top 10 Candle Analysis:
It identifies the ten largest candles (by body size) in each year and computes their average size, offering insight into the most significant market moves during that period.
Largest Candle Metrics:
The indicator determines the absolute size of the largest green and red candles in each year.
Percentage Move Calculation:
In addition to absolute values, it computes the largest move as a percentage of the open price for both green and red candles. This allows you to see not only which year experienced the biggest moves but also how those moves compare relative to the opening price.
Clear Tabular Display:
All the computed statistics are organized in an on-chart table, making it easy to compare yearly trends at a glance.
Ideal for daily and higher timeframes, this indicator is a valuable tool for long-term market analysis, enabling you to identify trends, assess volatility, and make informed trading decisions based on historical market behavior.
Script open-source
Nello spirito di TradingView, l'autore di questo script lo ha reso open source, in modo che i trader possano esaminarne e verificarne la funzionalità. Complimenti all'autore! Sebbene sia possibile utilizzarlo gratuitamente, ricordiamo che la ripubblicazione del codice è soggetta al nostro Regolamento.
Declinazione di responsabilità
Le informazioni e le pubblicazioni non sono intese come, e non costituiscono, consulenza o raccomandazioni finanziarie, di investimento, di trading o di altro tipo fornite o approvate da TradingView. Per ulteriori informazioni, consultare i Termini di utilizzo.