OPEN-SOURCE SCRIPT
Heiken Ashi with RSI Colors
📜 Description:
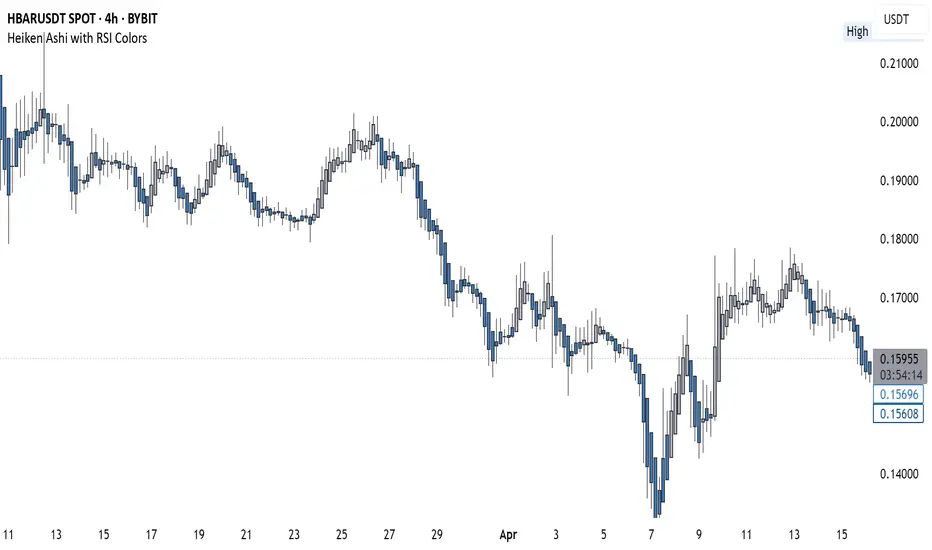
This indicator blends Heiken Ashi candlesticks with RSI-based color filters to help traders quickly assess both trend structure and momentum extremes in a single glance.
✅ Heiken Ashi Mode: Smooths out price action to highlight clearer trends and suppress noise
✅ RSI Coloring: Applies candle color changes based on whether RSI is overbought, oversold, or neutral
It allows traders to visually spot potential exhaustion zones, continuation trends, or early reversal areas with enhanced clarity.
🔧 Settings:
Use Heiken Ashi Candles: Toggle between standard candles and Heiken Ashi smoothed values
RSI Length: Controls the lookback for RSI calculation (default 14)
Overbought/Oversold Levels: Customize your thresholds for extreme conditions (default: 70/30)
🎨 Candle Color Logic:
Green (Lime): RSI is overbought → price may be overextended upward
Red: RSI is oversold → price may be overextended downward
Gray: RSI is between extremes → neutral momentum
💡 Use Cases:
Confirm trend momentum with Heiken Ashi structure
Spot potential reversal points using RSI extremes
Enhance entry/exit decisions by combining price action and momentum in a single visual
Script open-source
Nello spirito di TradingView, l'autore di questo script lo ha reso open source, in modo che i trader possano esaminarne e verificarne la funzionalità. Complimenti all'autore! Sebbene sia possibile utilizzarlo gratuitamente, ricordiamo che la ripubblicazione del codice è soggetta al nostro Regolamento.
Declinazione di responsabilità
Le informazioni e le pubblicazioni non sono intese come, e non costituiscono, consulenza o raccomandazioni finanziarie, di investimento, di trading o di altro tipo fornite o approvate da TradingView. Per ulteriori informazioni, consultare i Termini di utilizzo.