OPEN-SOURCE SCRIPT
MACD 3D with Signals [Quantigenics]
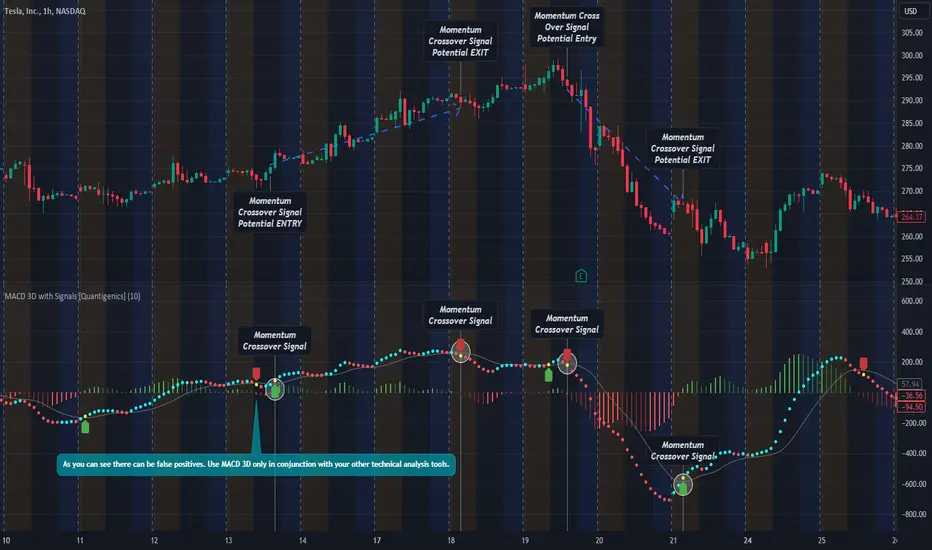
Quantigenics MACD 3D with Buy Sell Signals is a MACD-based trading indicator that aims to identify market trends and potential turning points, for Buy/Sell opportunities, by leveraging price data and volatility.
Unlike the traditional MACD indicator, the average price is calculated from the high, low, and close prices, from which a specialized MACD value is derived. This MACD value, combined with an average and standard deviation, takes into account volatility, and is used to generate an upper and lower boundary.
The indicator color-codes market trends: aqua indicates upward trends (signifying increased buying pressure), red suggests downward trends (increased selling pressure). When the MACD value crosses above the upper boundary or falls below the lower boundary, the color changes to yellow indicating a possible reversal point and "Momentum Crossover Signals" can be plotted at this point. "Standard Signal" arrows can also plotted when the MACD 3D changes from auqa to red and vice-versa.
A trendline is drawn at the median value, providing a baseline for comparison. A differential value, which measures the distance between the MACD value and the median line, provides additional insight into the price's deviation from this baseline (divergences from the underlying price can be spotted using this data as well). The differential is color-coded: green when MACD is above the median, and red when it's below, with darker shades representing a decreasing gap.
Alerts can be set to trigger with the "Standard Signal" arrows appearing after MACD 3D changes from auqa to red and vice-versa and when the "Momentum Crossover Signal" arrows appear when the MACD value crosses above the upper boundary or falls below the lower boundary indicating a potential reversal. Providing immediate notifications which can be especially helpful in larger time frames where it may take time for a trade setup to develop.
 NQ1!
NQ1!

 XAUUSD

Enjoy the MACD 3D indicator. Happy Trading!
Unlike the traditional MACD indicator, the average price is calculated from the high, low, and close prices, from which a specialized MACD value is derived. This MACD value, combined with an average and standard deviation, takes into account volatility, and is used to generate an upper and lower boundary.
The indicator color-codes market trends: aqua indicates upward trends (signifying increased buying pressure), red suggests downward trends (increased selling pressure). When the MACD value crosses above the upper boundary or falls below the lower boundary, the color changes to yellow indicating a possible reversal point and "Momentum Crossover Signals" can be plotted at this point. "Standard Signal" arrows can also plotted when the MACD 3D changes from auqa to red and vice-versa.
A trendline is drawn at the median value, providing a baseline for comparison. A differential value, which measures the distance between the MACD value and the median line, provides additional insight into the price's deviation from this baseline (divergences from the underlying price can be spotted using this data as well). The differential is color-coded: green when MACD is above the median, and red when it's below, with darker shades representing a decreasing gap.
Alerts can be set to trigger with the "Standard Signal" arrows appearing after MACD 3D changes from auqa to red and vice-versa and when the "Momentum Crossover Signal" arrows appear when the MACD value crosses above the upper boundary or falls below the lower boundary indicating a potential reversal. Providing immediate notifications which can be especially helpful in larger time frames where it may take time for a trade setup to develop.
Enjoy the MACD 3D indicator. Happy Trading!
Script open-source
Nello spirito di TradingView, l'autore di questo script lo ha reso open source, in modo che i trader possano esaminarne e verificarne la funzionalità. Complimenti all'autore! Sebbene sia possibile utilizzarlo gratuitamente, ricordiamo che la ripubblicazione del codice è soggetta al nostro Regolamento.
Declinazione di responsabilità
Le informazioni e le pubblicazioni non sono intese come, e non costituiscono, consulenza o raccomandazioni finanziarie, di investimento, di trading o di altro tipo fornite o approvate da TradingView. Per ulteriori informazioni, consultare i Termini di utilizzo.