OPEN-SOURCE SCRIPT
Aggiornato MR.Z Stoch RSI %K Reversal Signals
🟢 K Strategy Description
The K Strategy is a momentum-based trading technique using the %K line from the Stochastic Oscillator. It is designed to detect potential reversal points in price trends by identifying extreme conditions of overbought and oversold levels.
✅ Core Logic:
The strategy monitors the %K line (a smoothed form of RSI momentum).
A Buy Signal is triggered when:
The %K line dips to or below a defined lower threshold (commonly 30 or less).
This suggests the asset is oversold and may soon reverse upward.
A Sell Signal is triggered when:
The %K line peaks above an upper threshold (commonly 70 or more).
This suggests the asset is overbought and may reverse downward.
⚙️ Adjustable Parameters:
K Length: The sensitivity of the %K calculation (affects how fast it responds).
Buy Level: Set your oversold trigger (e.g., 20–40).
Sell Level: Set your overbought trigger (e.g., 60–100).
Signal Smoothing (optional): Helps reduce noise and avoid false triggers.
📈 Use Case:
This strategy is effective in ranging markets where prices frequently oscillate. It can also be used with other indicators (like EMA, volume filters, or price action confirmation) to increase accuracy in trending conditions.
Note di rilascio
🔍 OverviewThis indicator detects potential reversal points based on the %K line from the Stochastic RSI. It identifies local peaks and valleys in the %K line, optionally filtered by slope direction and threshold conditions. This tool is particularly useful for traders seeking early signals of trend changes, especially in overbought or oversold zones.
Key components include:
Stochastic RSI %K calculation
Local peak/valley detection
Optional slope filtering
Optional overbought/oversold thresholds
Signal plotting with alerts
Debug markers for rejected signals
Fully customizable settings
⚙️ Inputs & Settings
Setting Description
RSI Length Period for calculating RSI.
Stochastic Length Lookback length for Stoch RSI.
Smooth K Smoothing factor for the %K line.
Peak/Valley Lookback Number of bars on each side to confirm a local high/low in %K.
K Buy Max Threshold The maximum %K value allowed for a buy signal (typically oversold).
K Sell Min Threshold The minimum %K value required for a sell signal (typically overbought).
Use K Sell Threshold? Enable or disable the sell threshold condition.
Require Directional Slope Filter? Enforce that %K must slope down (peak) or up (valley) at signal point.
Show Debug Markers Displays gray X marks for rejected peaks/valleys (useful for analysis).
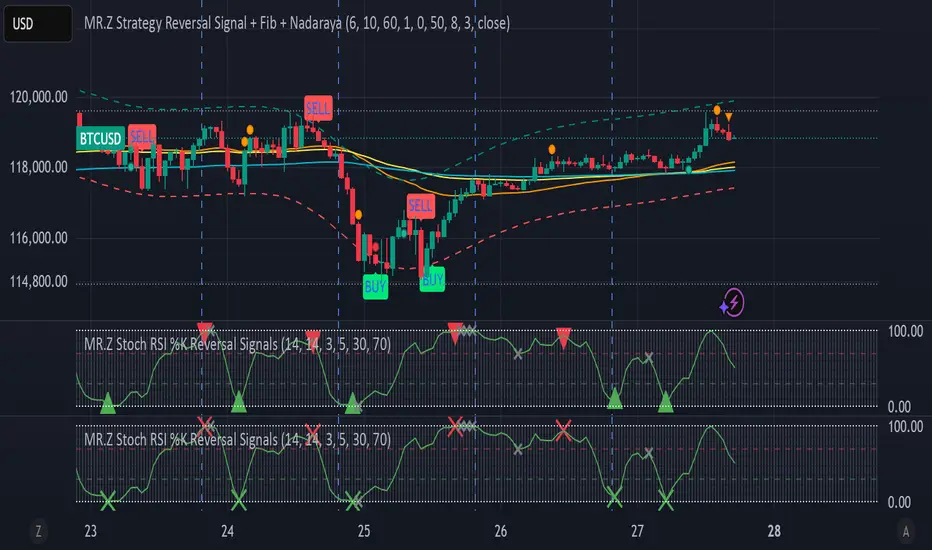
📈 Signal Logic
🔻 Sell Signal (Red Triangle Down)
Triggered when:
A local peak in %K is found.
%K >= K Sell Threshold (if enabled).
Optional: %K was sloping down at the peak.
🔺 Buy Signal (Green Triangle Up)
Triggered when:
A local valley in %K is found.
%K <= K Buy Threshold.
Optional: %K was sloping up at the valley.
❌ Debug Markers (Gray X)
Shown when:
A local peak/valley was found but rejected due to threshold or slope condition.
🔔 Alerts
"BUY Alert": Fires when a valid valley is confirmed.
"SELL Alert": Fires when a valid peak is confirmed.
You can use these alerts to trigger automation or notifications in TradingView.
📊 Plots
Green Line: Real-time %K value from Stochastic RSI.
Dashed Horizontal Lines: Thresholds for Buy/Sell levels.
Triangles: Valid BUY/SELL signals.
Gray Xs: Rejected signals (when debug mode is on).
✅ How to Use
Add the script to your chart from Pine Editor and click "Add to Chart".
Tune the parameters based on your trading strategy and timeframe.
Enable or disable the slope and threshold filters for stricter or more relaxed conditions.
Enable alerts and configure them for automatic signals.
Use the plotted signals to time potential entry and exit points, particularly at trend reversals.
Script open-source
Nello spirito di TradingView, l'autore di questo script lo ha reso open source, in modo che i trader possano esaminarne e verificarne la funzionalità. Complimenti all'autore! Sebbene sia possibile utilizzarlo gratuitamente, ricordiamo che la ripubblicazione del codice è soggetta al nostro Regolamento.
Declinazione di responsabilità
Le informazioni e le pubblicazioni non sono intese come, e non costituiscono, consulenza o raccomandazioni finanziarie, di investimento, di trading o di altro tipo fornite o approvate da TradingView. Per ulteriori informazioni, consultare i Termini di utilizzo.