OPEN-SOURCE SCRIPT
Aggiornato Bullseye PDHL
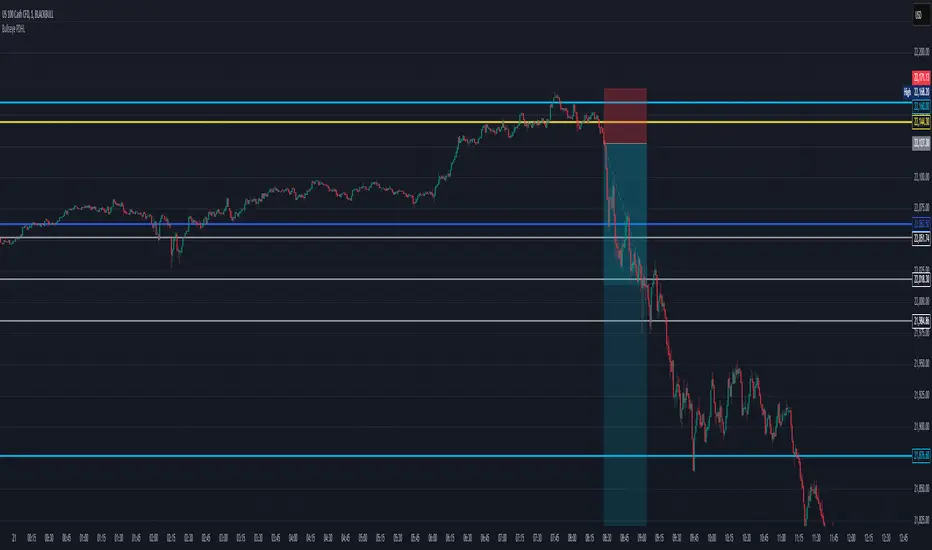
Bullseye PDHL Indicator
The Bullseye PDHL indicator is designed for traders who want to visually identify key price levels from the previous trading day, including the high, low, and significant Fibonacci retracement levels. This indicator helps traders understand potential support and resistance zones, which can be useful for planning entries and exits.
Key Features:
Previous Day’s High and Low:
Plots the previous day’s high and low as solid lines on the chart to easily identify important levels from the prior session.
These levels serve as critical support and resistance markers, which are often respected by the market.
Fibonacci Retracement Levels:
Plots three Fibonacci retracement levels (38.2%, 50%, and 61.8%) between the previous day’s high and low.
These levels are key reference points for assessing potential pullbacks or retracements during the current trading day.
Visual Representation:
The previous day’s high and low are plotted in cyan for easy differentiation.
The Fibonacci retracement levels (30%, 50%, 60%) are plotted in white, providing a clear visual reference for traders.
This indicator can help traders identify important reaction zones and areas where price might reverse or consolidate, making it a valuable addition for technical analysis.
Note di rilascio
Cool Update to Bullseye PDHL on TradingView!Hey traders! 🚀 Check out the latest tweak to the Bullseye PDHL indicator—it's now got neat switches to show or hide yesterday's open and close prices right on your charts. Customize your view, keep your charts slick, and make analyzing those price moves easier than ever! Jump into your next trade with style with the new Bullseye PDHL!
Script open-source
Nello spirito di TradingView, l'autore di questo script lo ha reso open source, in modo che i trader possano esaminarne e verificarne la funzionalità. Complimenti all'autore! Sebbene sia possibile utilizzarlo gratuitamente, ricordiamo che la ripubblicazione del codice è soggetta al nostro Regolamento.
Declinazione di responsabilità
Le informazioni e le pubblicazioni non sono intese come, e non costituiscono, consulenza o raccomandazioni finanziarie, di investimento, di trading o di altro tipo fornite o approvate da TradingView. Per ulteriori informazioni, consultare i Termini di utilizzo.