PROTECTED SOURCE SCRIPT
Accumulation/Distribution Oscillator
# Short description
A clean, volume-weighted Accumulation/Distribution Oscillator (ADO) that highlights buying/selling pressure by comparing cumulative AD to its EMA — ideal for confirming trends, spotting divergences, and timing entries with volume context.
# Full description
**Overview**
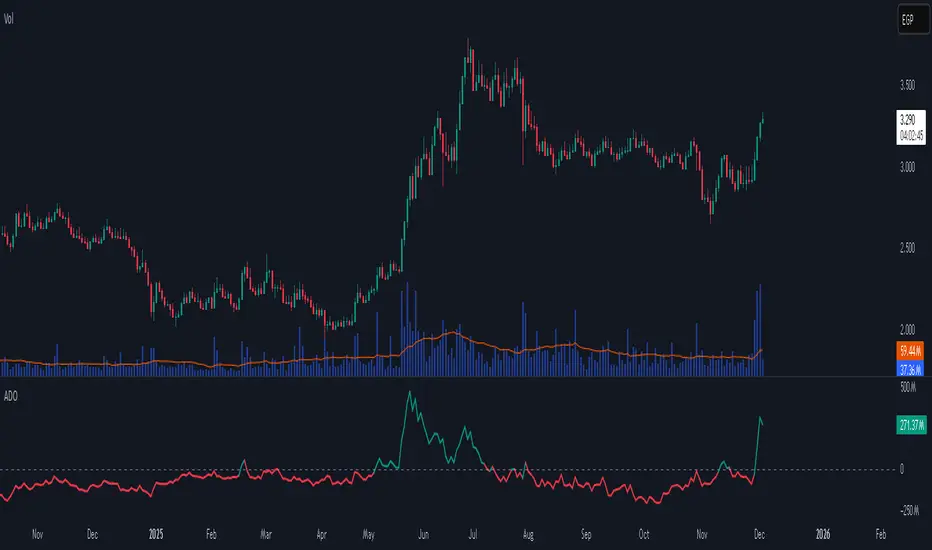
The Accumulation/Distribution Oscillator (ADO) measures the relationship between price and volume by taking a cumulative Accumulation/Distribution value and subtracting its exponential moving average. The resulting oscillator emphasizes recent shifts in accumulation (buying) and distribution (selling), making it easier to spot momentum changes and volume-driven confirmations or divergences.
**How it works (brief)**
* Computes the standard accumulation/distribution contribution each bar using price position within the range and multiplies it by volume.
* Builds a cumulative AD series and smooths it with an EMA.
* The oscillator = cumulative AD − EMA(cumulative AD). Positive values indicate rising accumulation relative to the trend, negative values indicate rising distribution.
**Inputs**
* `length` — EMA smoothing period (default: 20). Adjust to tune sensitivity: lower values = faster signals, higher values = smoother trend.
**Interpretation & signals**
* **Above zero**: recent accumulation momentum — bullish bias.
* **Below zero**: recent distribution momentum — bearish bias.
* **Crosses of zero**: simple entry/exit trigger (cross above = potential long, cross below = potential short).
* **Divergences**: price making new highs while ADO fails to make new highs → bearish divergence (sell signal). Price making new lows while ADO fails to make new lows → bullish divergence (buy signal).
* **Slope and magnitude**: steep, growing positive readings suggest strong buying pressure; steep, growing negative readings suggest strong selling pressure.
**Suggested usage**
* Use ADO to confirm breakout strength: a price breakout with ADO rising above zero has higher probability.
* Combine with trend filters (e.g., moving averages) to trade in the direction of the main trend.
* Use divergence with price action or candles for higher-probability reversal setups.
* Best applied on intraday and swing timeframes where volume data is reliable. May be less effective on low-volume or synthetic data.
**Alert examples (copy into TradingView alert message)**
* `ADO Bullish: Oscillator crossed above 0`
* `ADO Bearish: Oscillator crossed below 0`
* `ADO Momentum Up: Oscillator turned positive and rising`
* `ADO Divergence: Price made new high but ADO did not — check for potential reversal`
**Practical tips**
* Shorten `length` (e.g., 8–12) for more responsive signals on lower timeframes; lengthen (e.g., 30–50) for smoother, long-term signals.
* Confirm signals with volume profile or volume spike filters to avoid false breakouts.
* Always validate with support/resistance and manage risk with stops sized to your strategy.
**Disclaimer**
This indicator is a technical tool intended to assist analysis — not a standalone trading system. Backtest and paper-trade any strategy before using real capital. The author and publisher are not responsible for trading outcomes.
A clean, volume-weighted Accumulation/Distribution Oscillator (ADO) that highlights buying/selling pressure by comparing cumulative AD to its EMA — ideal for confirming trends, spotting divergences, and timing entries with volume context.
# Full description
**Overview**
The Accumulation/Distribution Oscillator (ADO) measures the relationship between price and volume by taking a cumulative Accumulation/Distribution value and subtracting its exponential moving average. The resulting oscillator emphasizes recent shifts in accumulation (buying) and distribution (selling), making it easier to spot momentum changes and volume-driven confirmations or divergences.
**How it works (brief)**
* Computes the standard accumulation/distribution contribution each bar using price position within the range and multiplies it by volume.
* Builds a cumulative AD series and smooths it with an EMA.
* The oscillator = cumulative AD − EMA(cumulative AD). Positive values indicate rising accumulation relative to the trend, negative values indicate rising distribution.
**Inputs**
* `length` — EMA smoothing period (default: 20). Adjust to tune sensitivity: lower values = faster signals, higher values = smoother trend.
**Interpretation & signals**
* **Above zero**: recent accumulation momentum — bullish bias.
* **Below zero**: recent distribution momentum — bearish bias.
* **Crosses of zero**: simple entry/exit trigger (cross above = potential long, cross below = potential short).
* **Divergences**: price making new highs while ADO fails to make new highs → bearish divergence (sell signal). Price making new lows while ADO fails to make new lows → bullish divergence (buy signal).
* **Slope and magnitude**: steep, growing positive readings suggest strong buying pressure; steep, growing negative readings suggest strong selling pressure.
**Suggested usage**
* Use ADO to confirm breakout strength: a price breakout with ADO rising above zero has higher probability.
* Combine with trend filters (e.g., moving averages) to trade in the direction of the main trend.
* Use divergence with price action or candles for higher-probability reversal setups.
* Best applied on intraday and swing timeframes where volume data is reliable. May be less effective on low-volume or synthetic data.
**Alert examples (copy into TradingView alert message)**
* `ADO Bullish: Oscillator crossed above 0`
* `ADO Bearish: Oscillator crossed below 0`
* `ADO Momentum Up: Oscillator turned positive and rising`
* `ADO Divergence: Price made new high but ADO did not — check for potential reversal`
**Practical tips**
* Shorten `length` (e.g., 8–12) for more responsive signals on lower timeframes; lengthen (e.g., 30–50) for smoother, long-term signals.
* Confirm signals with volume profile or volume spike filters to avoid false breakouts.
* Always validate with support/resistance and manage risk with stops sized to your strategy.
**Disclaimer**
This indicator is a technical tool intended to assist analysis — not a standalone trading system. Backtest and paper-trade any strategy before using real capital. The author and publisher are not responsible for trading outcomes.
Script protetto
Questo script è pubblicato come codice protetto. Tuttavia, è possibile utilizzarle liberamente e senza alcuna limitazione – ulteriori informazioni qui.
Passionate technical analysts crafting unique, proprietary indicators. We deliver fresh insights designed to redefine your understanding of the market. We welcome new ideas—message us with your concept, and we’ll build it for you free of charge.
Declinazione di responsabilità
Le informazioni e le pubblicazioni non sono intese come, e non costituiscono, consulenza o raccomandazioni finanziarie, di investimento, di trading o di altro tipo fornite o approvate da TradingView. Per ulteriori informazioni, consultare i Termini di utilizzo.