OPEN-SOURCE SCRIPT
Multi-Crypto Principal Component Analysis
Version 0.2
## 📌 Multi-Crypto Principal Component Analysis (PCA) — Indicator Summary
### 🎯 Purpose
This indicator identifies **cryptocurrency assets that are behaving differently** from the rest of the market, using a simplified approach inspired by Principal Component Analysis (PCA). It’s designed to help traders spot **cross-market divergences**, detect outliers, and improve asset selection and correlation-based strategies.
### ⚙️ How It Works
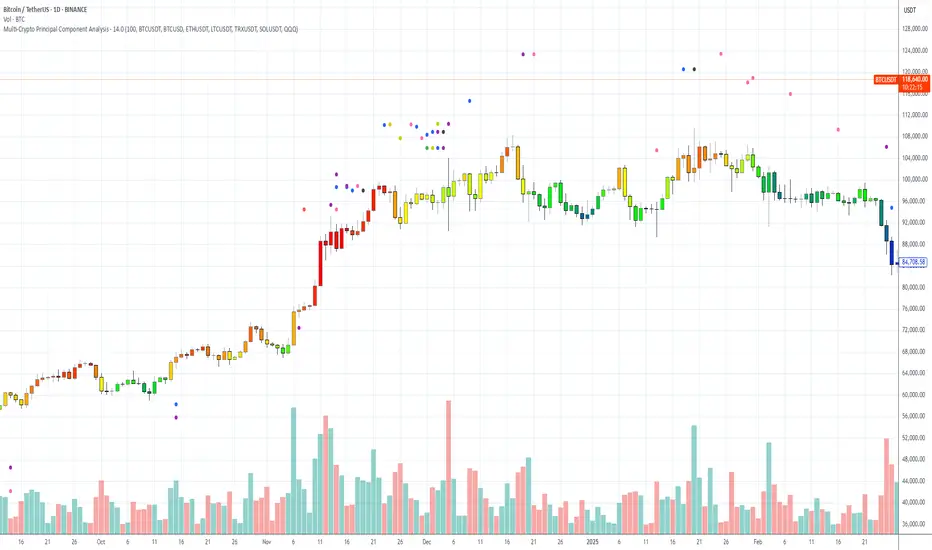
The indicator analyzes the **log returns** of up to 7 user-defined assets over a configurable lookback period (default: 100 bars). It computes the **z-score** (standardized deviation) for each asset’s return series and compares it against the average behavior of the group.
If an asset’s behavior deviates significantly (beyond a threshold of 1.5 standard deviations), it’s flagged as an **outlier**.
- Each outlier is plotted as a **colored dot horizontally spaced** above the price bar
- Up to **3 dots per bar** are shown for visual clarity
This PCA-style detection works in real time, directly on the chart, and gives you a quick overview of which assets are breaking correlation.
### 🔧 Inputs
- 🕒 **Lookback Period**: Number of bars to analyze (default: 100)
- 🔢 **Assets 1–7**: Choose any 7 crypto symbols from any exchange
- 🎨 **Colors**: Predefined per asset (e.g. BTCUSDT = red, ETHUSDT = yellow)
- 📈 **Threshold**: Internal (1.5 std dev); adjustable in code if needed
### 📊 Outputs
- 🟢 Dots above candles representing assets that are acting as outliers
- 🧠 Real-time clustering insight based on statistical deviation
- 🧭 Spatially spaced dots to avoid visual overlap when multiple outliers appear
### ⚠️ Limitations
- This is a **PCA-inspired approximation**, not true matrix-based PCA
- It does **not compute principal components or eigenvectors**
- Sensitivity may vary with asset volatility or sparse trading data
- Real PCA requires external tools like Python or R for full dimensional analysis
This tool is ideal for traders who want real-time crypto correlation insights without needing external data science platforms. It’s lightweight, fast, and highly visual — and gives you a powerful lens into market dislocations across multiple assets.
## 📌 Multi-Crypto Principal Component Analysis (PCA) — Indicator Summary
### 🎯 Purpose
This indicator identifies **cryptocurrency assets that are behaving differently** from the rest of the market, using a simplified approach inspired by Principal Component Analysis (PCA). It’s designed to help traders spot **cross-market divergences**, detect outliers, and improve asset selection and correlation-based strategies.
### ⚙️ How It Works
The indicator analyzes the **log returns** of up to 7 user-defined assets over a configurable lookback period (default: 100 bars). It computes the **z-score** (standardized deviation) for each asset’s return series and compares it against the average behavior of the group.
If an asset’s behavior deviates significantly (beyond a threshold of 1.5 standard deviations), it’s flagged as an **outlier**.
- Each outlier is plotted as a **colored dot horizontally spaced** above the price bar
- Up to **3 dots per bar** are shown for visual clarity
This PCA-style detection works in real time, directly on the chart, and gives you a quick overview of which assets are breaking correlation.
### 🔧 Inputs
- 🕒 **Lookback Period**: Number of bars to analyze (default: 100)
- 🔢 **Assets 1–7**: Choose any 7 crypto symbols from any exchange
- 🎨 **Colors**: Predefined per asset (e.g. BTCUSDT = red, ETHUSDT = yellow)
- 📈 **Threshold**: Internal (1.5 std dev); adjustable in code if needed
### 📊 Outputs
- 🟢 Dots above candles representing assets that are acting as outliers
- 🧠 Real-time clustering insight based on statistical deviation
- 🧭 Spatially spaced dots to avoid visual overlap when multiple outliers appear
### ⚠️ Limitations
- This is a **PCA-inspired approximation**, not true matrix-based PCA
- It does **not compute principal components or eigenvectors**
- Sensitivity may vary with asset volatility or sparse trading data
- Real PCA requires external tools like Python or R for full dimensional analysis
This tool is ideal for traders who want real-time crypto correlation insights without needing external data science platforms. It’s lightweight, fast, and highly visual — and gives you a powerful lens into market dislocations across multiple assets.
Script open-source
Nello spirito di TradingView, l'autore di questo script lo ha reso open source, in modo che i trader possano esaminarne e verificarne la funzionalità. Complimenti all'autore! Sebbene sia possibile utilizzarlo gratuitamente, ricordiamo che la ripubblicazione del codice è soggetta al nostro Regolamento.
Declinazione di responsabilità
Le informazioni e le pubblicazioni non sono intese come, e non costituiscono, consulenza o raccomandazioni finanziarie, di investimento, di trading o di altro tipo fornite o approvate da TradingView. Per ulteriori informazioni, consultare i Termini di utilizzo.