OPEN-SOURCE SCRIPT
CUSTOM intraday volatility chart clock
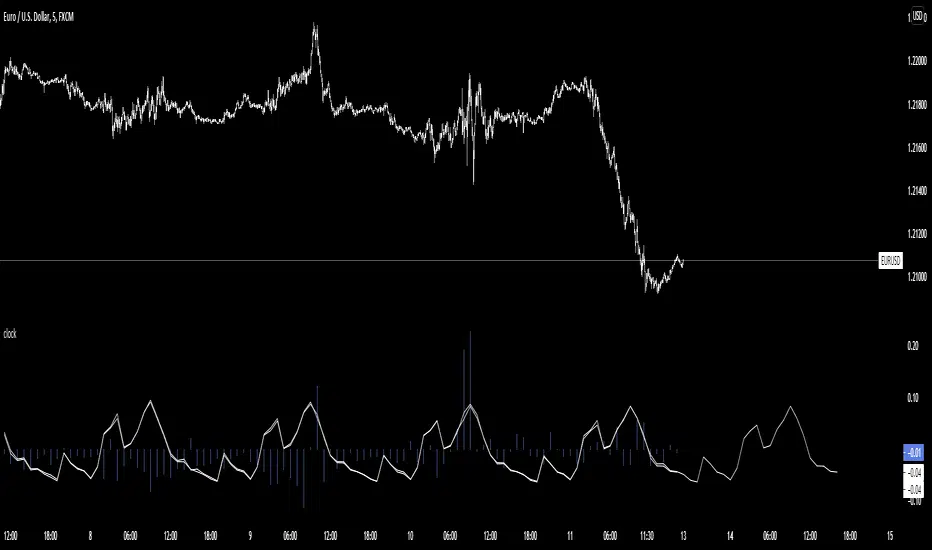
Chart clock showing an overview of the day's expected and actual intraday volatility.
In white are only the expected volatility scores. The expected increase or decrease in volatility at any given hour of day compared to the average of the whole day's expected volatility. A 0.5 score two hours from now means that you can expect that hour to be 0.5% more volatile than the average of whole day's volatility.
In blue are the actual or realized volatility scores; the difference between that hour's volatility and what was expected to be its volatility is displayed as a blue bar. If two three hours ago was expected to be a more volatile hour of the day but no movement occurred, a large down bar will print for that hour.
Large swings of daily volatility (i.e. this month is much more or much less volatility than the last) will bias the clock usually only a little higher or lower, although historical volatility peaks/depressions will show the blue realized volatility score to be consistently high/low.
If requested I can change the look of the indicator or add input settings for the input length of clock, which for now is set to 20 bars, which is an approximation of the last month's realized volatility.
Script open-source
Nello spirito di TradingView, l'autore di questo script lo ha reso open source, in modo che i trader possano esaminarne e verificarne la funzionalità. Complimenti all'autore! Sebbene sia possibile utilizzarlo gratuitamente, ricordiamo che la ripubblicazione del codice è soggetta al nostro Regolamento.
Declinazione di responsabilità
Le informazioni e le pubblicazioni non sono intese come, e non costituiscono, consulenza o raccomandazioni finanziarie, di investimento, di trading o di altro tipo fornite o approvate da TradingView. Per ulteriori informazioni, consultare i Termini di utilizzo.